SQL Cached Queries Test
SQL Server maintains a cache, but not with canned results for queries. In an OLTP system, many tables are frequently updated; it is therefore highly unlikely that the same query yields the same result twice. Similarly, the likelihood of the same query reappearing with exactly the same parameters is also very less. What SQL Server stores in its cache therefore, are recently accessed data pages, as well as query plans for recently submitted queries and invoked stored procedures. This makes it possible to retrieve the result of a query without accessing the disk for frequently accessed tables. Too few queries in the cache means more direct disk accesses! To minimize reads/writes to physical disks, more number of queries should execute in the cache. Using this test, you can determine the number of queries that are currently executing in the cache and also figure out the impact of cache misses on the physical disks. These metrics reveal whether/not cache usage is at a desired level. In the process, the test also measures the resource usage of and the I/O activity generated by the cached queries and sheds light on time-consuming, resource-intensive and I/O-intensive queries that are executing in the cache.
Target of the test : A Microsoft SQL server
Agent deploying the test : An internal agent
Outputs of the test : One set of results for every Microsoft SQL server monitored
|
| Measurement | Description | Measurement Unit | Interpretation |
|---|---|---|---|
|
Physical reads |
Indicates the rate at which the queries directly executed on and read from the physical disk. |
Reads/Sec |
A high value could indicate that direct disk accesses are occurring too frequently. This in turn implies poor cache usage. You may consider resizing your cache to accommodate more number of queries, so that direct disk reads are reduced. |
|
Avg physical reads |
Indicates the average number of reads performed by the queries that executed directly on the physical disk. |
Number |
A high value indicates that one/more queries are reading too frequently from the physical disk. This is an unhealthy practice and can be attributed poor cache usage. Use the detailed diagnosis of this measure to know which queries are not executing in the cache and the number of times each of these queries read directly from the physical disk. This way, you can quickly identify that query which exerts the maximum pressure on the physical disk. Additionally detailed diagnosis will also reveal: SQL handle - Token representing the batch of the query. Statement start offset and Statement end offset - Specifying the position of current executing statement. Query Hash - Binary hash of the query used to identify similar queries. Using this information you can identify the exact statements and stored procedure which it is part of. |
|
Logical reads |
Indicates the rate of data reads performed by queries to the cache. |
Reads/Sec |
A high value is desired for this measure. A low value is indicative of ineffective cache usage, typically caused by improper cache size. |
|
Avg logical reads |
Indicates the average number of data reads performed by queries to the cache. |
Number |
A high value is desired for this measure. A low value is indicative of ineffective cache usage, typically caused by improper cache size. You can also use the detailed diagnosis of this measure to view the top-5 queries in terms of number of logical reads. This way, you can precisely identify the most I/O-intensive query to the cache. Additionally detailed diagnosis will also reveal: SQL handle - Token representing the batch of the query. Statement start offset and Statement end offset - Specifying the position of current executing statement. Query Hash - Binary hash of the query used to identify similar queries. Using this information you can identify the exact statements and stored procedure which it is part of. |
|
Logical writes |
Indicates the rate at which the cached queries performed writes. |
Writes/Sec |
A high value is desired for this measure. A low value is indicative of ineffective cache usage, typically caused by improper cache size. |
|
Avg logical writes |
Indicates the average number of times data writes were performed by a query to the cache. |
Number |
A high value is desired for this measure. A low value is indicative of ineffective cache usage, typically caused by improper cache size. You can also use the detailed diagnosis of this measure to view the top-5 queries in terms of number of logical writes. This way, you can precisely identify the most I/O-intensive query to the cache. |
|
CPU time |
Indicates the percentage of time for which the cached queries hogged the CPU. |
Percent |
A high value is indicative of excessive CPU usage by the cached queries. Use the detailed diagnosis of this measure to know which query is CPU-intensive. The detailed diagnosis of this measure will reveal: SQL handle - Token representing the batch of the query. Statement start offset and Statement end offset - Specifying the position of current executing statement. Query Hash - Binary hash of the query used to identify similar queries. Using this information you can identify the exact statements and stored procedure which it is part of. |
|
Max elapsed time |
Indicates the maximum time taken by the cached queries for execution. |
Secs |
If the value of this measure is very high, it could either indicate that the database is unable to process the queries quickly or that one/more queries to the database are taking too long to execute. Improper indexing and fragmented tables in the database are common causes for slowdowns at the database-level. Besides the above, queries that are improperly structured can also take time to execute. The longer a query executes on the database, higher would be the resource consumption of that query. It is therefore imperative that such resource-intensive queries are quickly isolated and fine-tuned, so as to prevent degradations in the performance of the database server. Using the detailed diagnosis of this measure, you can rapidly identify the resource-intensive queries to the database. The detailed diagnosis of this measure will reveal: SQL handle - Token representing the batch of the query. Statement start offset and Statement end offset - Specifying the position of current executing statement. Query Hash - Binary hash of the query used to identify similar queries. Using this information you can identify the exact statements and stored procedure which it is part of. |
|
Recently executed queries |
Indicates the number of queries that executed in the cache since the last measurement period. |
Number |
A consistent rise in the value of this measure is a sign of optimal cache usage and minimal direct disk accesses. |
|
Average elapsed time |
Indicates the average time taken by queries to execute on this database. |
Seconds |
If the value of this measure is very high, it could either indicate that the database is unable to process the queries quickly or that one/more queries to the databases are taking too long to execute. |
The detailed diagnosis of the Avg physical read measure lists the top-5 queries in terms of the number of times they read directly from the physical disk. The query that exerts the maximum pressure on the disk can thus be isolated.
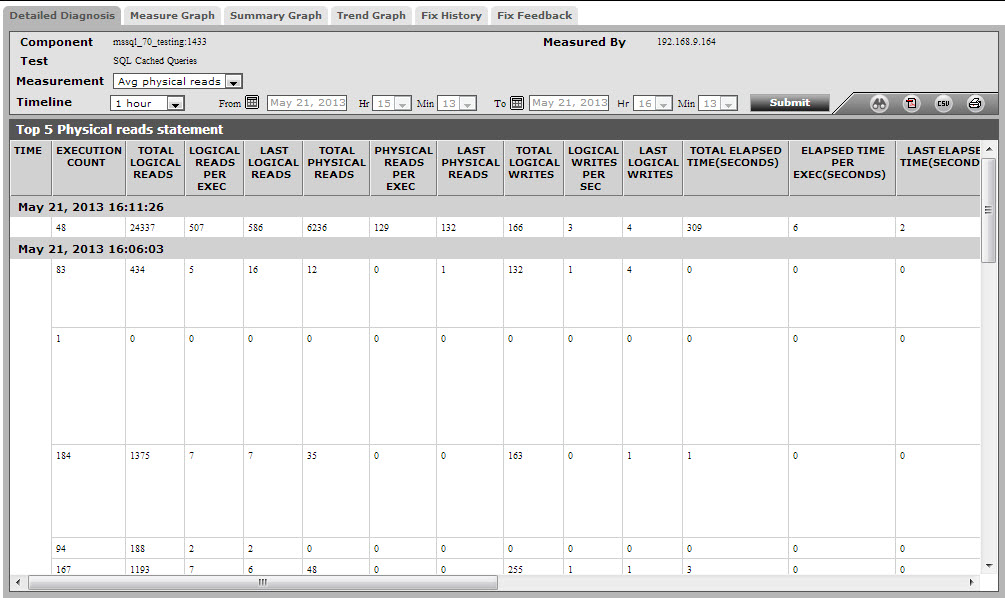
Figure 1 : The detailed diagnosis of the Avg physical reads measure
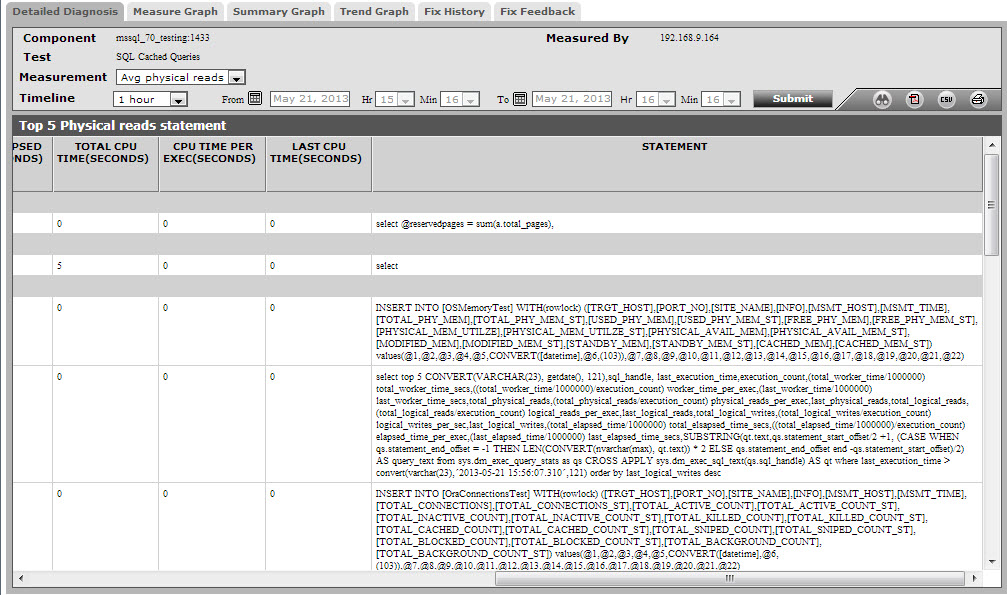
Figure 2 : The detailed diagnosis of the Avg physical reads measure
The detailed diagnosis of the Avg logical reads measure lists the top-5 cached queries in terms of the number of logical reads. The cached query that performed the maximum number of data reads can be identified. You can even analyse the query to figure out whether the number of reads it generates is justified or not; if not, you may have to optimize the query.
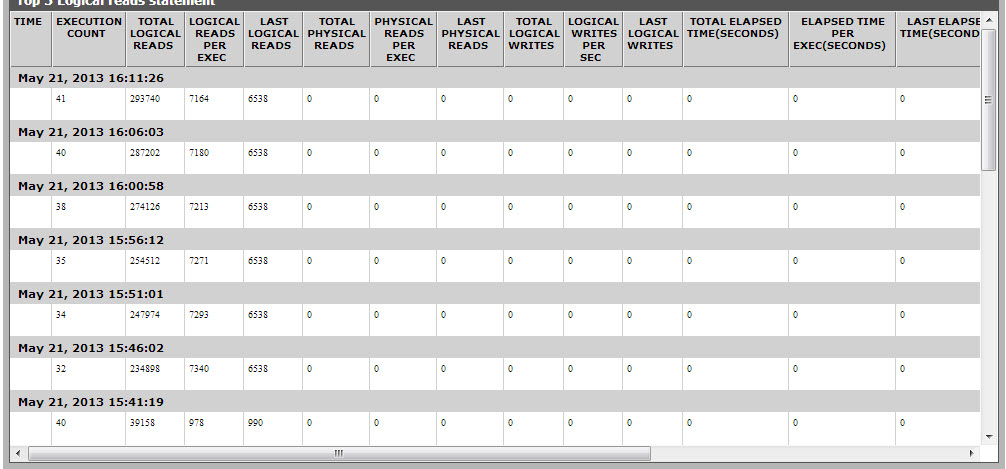
Figure 3 : The detailed diagnosis of the Avg logical reads measure
The detailed diagnosis of the Avg logical writes measure lists the top-5 cached queries in terms of the number of logical writes. The cached query that performed the maximum number of data writes can be inferred from this. You can even analyze the query to figure out whether the number of writes it generates is justified or not; if not, you may have to optimize the query.
Figure 4 : The detailed diagnosis of the Avg logical reads measure
The detailed diagnosis of the Max elapsed time measure lists the top-5 cached queries in terms of the time they took to complete execution. The query that took the longest time to execute can thus be easily identified. You can analyse whey that query took long to execute, assess the resource foot print of that query, and if required, attempt to fine-tune the query to reduce execution time / resource usage.
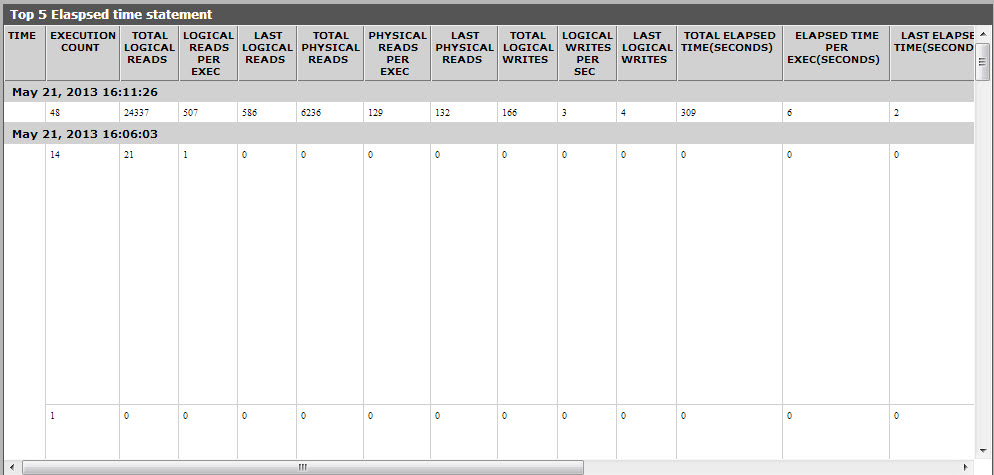
Figure 5 : The detailed diagnosis of the Max elapsed time measure
The detailed diagnosis of the Cpu time measure lists the top-5 cached queries in terms of CPU usage. The most CPU-intensive query can thus be identified and the reasons for the same can be determined.
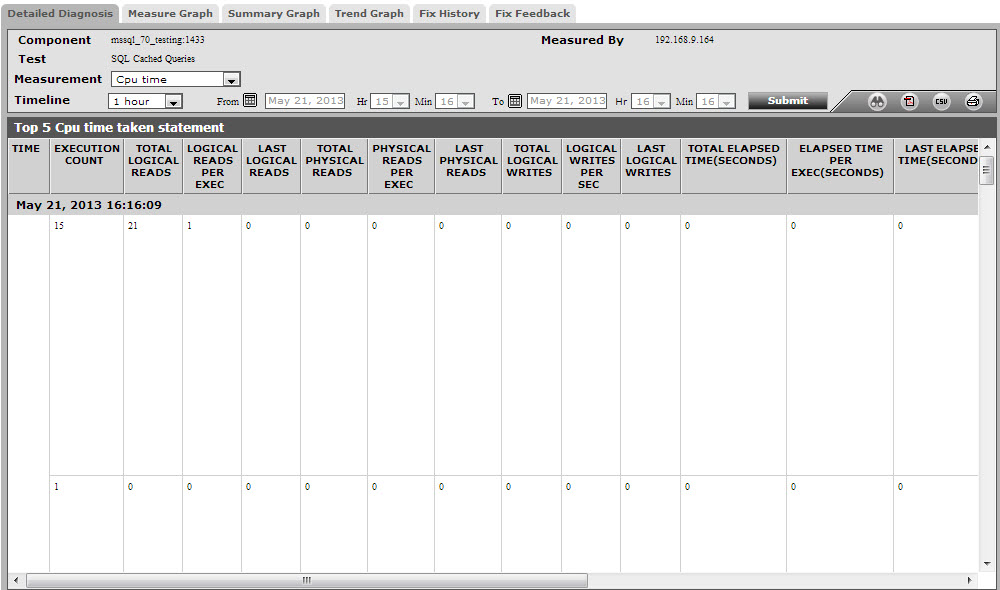
Figure 6 : The detailed diagnosis of the Cpu time measure