SQL Locks Test
This test monitors the locking activity of various transactions supported by a Microsoft SQL server.
Target of the test : A Microsoft SQL server
Agent deploying the test : An internal agent
Outputs of the test : One set of results for every Microsoft SQL server being monitored
|
| Measurement | Description | Measurement Unit | Interpretation |
|---|---|---|---|
|
Avg wait time for locks: |
This gives the average amount of wait time for each lock request that resulted in a wait. |
Secs |
A high value may indicate that there is contention for locks in the system. When the average wait time for locks is high, users may have to wait for their transactions to complete. This metric reports the average wait time for a variety of locks, including database, extent, key, page, RID, and table. When the average wait time is high, use the SQL profiler to identify which lock(s) is causing transaction delays. The detailed diagnosis of the Avg wait time for locks measure, if enabled, provides the average wait time for each lock type. |
|
Lock requests: |
This value gives the number of new locks and lock conversions requested from the lock manager per second. |
Reqs/Sec |
A high value indicates that there is high locking activity in the system and may need close scrutiny for the type of locks being requested. |
|
Lock waits: |
This value indicates the number of lock requests per second that could not be satisfied immediately and required the caller to wait before being granted the lock. |
Waits/Sec |
A high value of waits can have an adverse impact on application performance. Possible reasons for this behavior could be:
|
|
Deadlocks: |
Number of lock requests/sec that resulted in a deadlock |
Deadlocks/Sec |
A deadlock may arise due to various situations including bad design of queries and deficient coding practices. A deadlock is a situation where both/all the lock requestors are in a mutual or a multi-way tie. |
|
Lock timeouts: |
indicates the number of lock requests per second that timed out, including requests for NOWAIT locks. |
Timeouts/Sec |
The LOCK_TIMEOUT setting allows an application to set a maximum time that a statement waits on a blocked resource. When a statement has waited longer than the LOCK_TIMEOUT setting, the blocked statement is canceled automatically, and error message 1222 (Lock request time-out period exceeded) is returned to the application. Any transaction containing the statement, however, is not rolled back. A high value for this measure indicates that many statements were cancelled, as they could not acquire a lock on a resource for a long time. This may be due to another extent lock holding the resource ( An extent lock is the one which locks multiple resources). In such a situation, use the detailed diagnosis of the SQL Blocker Processes test to know which statements have been blocked for a long time, and which statements are blocking them. |
The detailed diagnosis of the Lock requests measure, if enabled, provides the rate of locks for each lock type (see Figure 1).
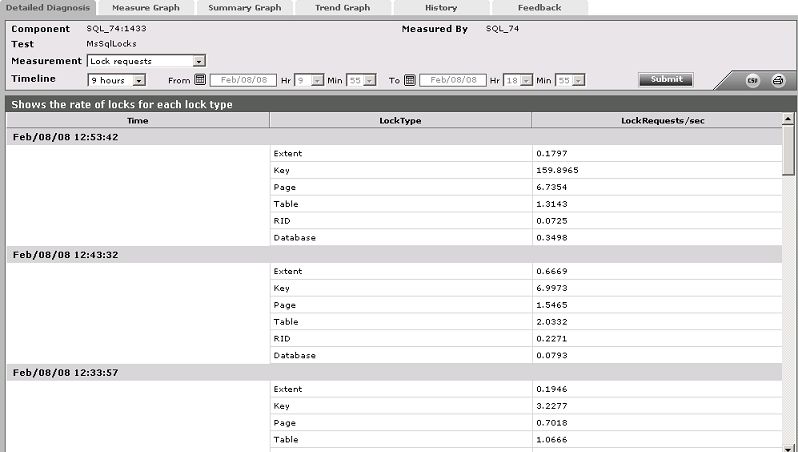
Figure 1 : The detailed diagnosis of the Lock requests measure
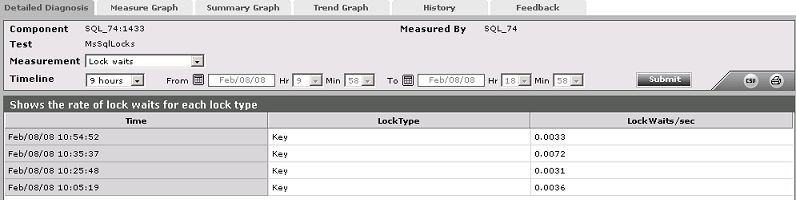
The detailed diagnosis of the Lock waits measure, if enabled, displays the rate of lock waits for each lock type (see Figure 2).