SQL System Processes Test
This test reports details about the system processes running on a Microsoft SQL server.
This test is disabled by default. To enable the test, go to the enable / disable tests page using the menu sequence : Agents -> Tests -> Enable/Disable, pick Microsoft SQL as the desired Component type, set Performance as the Test type, choose the test from the disabled tests list, and click on the < button to move the test to the ENABLED TESTS list. Finally, click the Update button.
Target of the test : a Microsoft SQL server
Agent deploying the test : An internal agent
Outputs of the test : One set of results for every Microsoft SQL server being monitored.
|
| Measurement | Description | Measurement Unit | Interpretation |
|---|---|---|---|
|
Total processes: |
The total number of Microsoft SQL server processes |
Number |
The value of this measure is the sum of the number of background, running, sleeping, rollback, and suspended processes. |
|
Background processes: |
The total number of background processes run by the Microsoft SQL server rather than by a user process |
Number |
The detailed diagnosis of this measure, if enabled, provides the details pertaining to the background processes currently executing. |
|
Running processes: |
The total number of running processes |
Number |
The detailed diagnosis of this measure, if enabled, provides details such as the ID of the running processes, the user executing each of the processes, the database on which every process is executing etc. Note that while the query used by the eG agent for collecting the metrics of this test will be counted as a Running process, the detailed diagnosis of this measure will not include this eG query. |
|
Sleeping processes: |
The total number of sleeping processes |
Number |
The detailed diagnosis of this measure, if enabled, provides details such as the ID of the sleeping processes, the user executing each of the processes, the database on which every process is executing, the sleep status, sleep time etc. |
|
Rollback processes: |
The total number of processes that were rolled back |
Number |
The detailed diagnosis of this measure, if enabled, reveals information such as the ID of the rolled back processes, the user executing each of the processes, the database on which every process is executing, etc. |
|
Blocked processes: |
If a process attempts to access a resource that is already in use by another process, then such a process will be blocked until such time that the other process releases the resource. This measures indicates the total number of blocked processes. |
Number |
The detailed diagnosis of the Blocked processes measure, if enabled, reveals information such as the ID of the blocked processes, the user executing each of the processes, the database on which every process is executing, the waiting time of the blocked process, etc. These details aid the user in identifying the blocked processes, the processes that are blocking them (i.e. the process that currently holds a lock on the resource), and also the duration for which the processes have been blocked. If a process is found to hold a lock for too long a time, then such processes can be killed so as to free the resource for the corresponding blocked process. |
|
Suspended processes: |
Indicates the number of processes that are currently suspended. |
Number |
A Microsoft SQL server marks a process as “suspended” when the process has made a request to a non-SQL process or resource and is awaiting a response. This happens a lot when you have slow disk drives; processes will be suspended while the SQL server waits for the drive to return data or report back after committing. Ideally, the value of this measure should be low. The detailed diagnosis of this measure, if enabled, will provide the complete details of the suspended processes. |
|
|
Rollback processes: Indicates the number of sessions initiated by this user in which transaction rollbacks are in progress. |
Number |
Ideally, the value of this measure should be low. If this value is very close to the Total processes value for a user, it indicates that many transactions executed by that user are being rolled back. This is a cause for concern, as rollbacks are expensive operations that need to be kept at a minimum; if not, processing overheads increase and the overall performance of the server deteriorates. The detailed diagnosis of this measure, if enabled, will provide the complete details of the user sessions with transaction rollbacks. |
|
Dormant processes: |
Indicates the number of processes being reset by the Microsoft SQL server. |
Number |
Ideally, the value of this measure should be low. If this value is high, it indicates that many processes are being reset. The detailed diagnosis of this measure, if enabled, will provide the complete details of the reset processes. |
|
Pending processes: |
Indicates the number of processes that are waiting for a worker thread to become available. |
Number |
A low value is desired for this measure. If the value of this measure is high, it indicates that many are unable to execute owing to the lack of worker threads. Use the detailed diagnosis of this measure to know which processes are waiting for worker threads. |
|
Spinloop processes: |
Indicates the number of processes that are waiting for a spinlock to free. |
Number |
Spinlocks are lightweight synchronization primitives which are used to protect access to data structures. They are generally used when it is expected that access to a given data structure will need to be held for a very short period of time. When a thread attempting to acquire a spinlock is unable to obtain access it executes in a loop periodically checking to determine if the resource is available instead of immediately yielding. After some period of time a thread waiting on a spinlock will yield before it is able to acquire the resource in order to allow other threads running on the same CPU to execute. This is known as a backoff. The detailed diagnosis of this measure will reveal the processes that are waiting for spinlock to free. |
The detailed diagnosis of the Background processes measure, if enabled, provides the details pertaining to the background processes currently executing (see Figure 1). This information helps the user identify the processes consuming excessive CPU and memory resources. If found necessary, such processes can be killed so as to free adequate CPU resources.
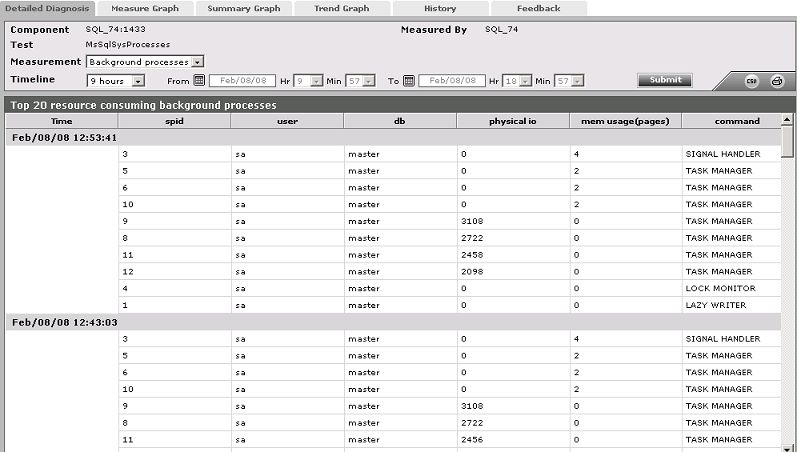
Figure 1 : The detailed diagnosis of the Background processes measure
The detailed diagnosis of the Running processes measure, if enabled, provides details such as the ID of the running processes, the user executing each of the processes, the database on which every process is executing etc. This information enables the user to understand the general user behavior on the server (see Figure 2).
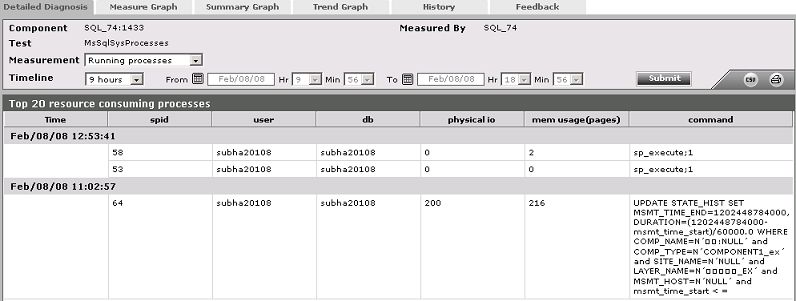
Figure 2 : The detailed diagnosis of the Running processes measure
The detailed diagnosis of the Sleeping processes measure, if enabled, provides details such as the ID of the sleeping processes, the user executing each of the processes, the database on which every process is executing, the sleep status, sleep time etc. Using this information, users can identify those processes that have been idle for a long period of time (see Figure 3).
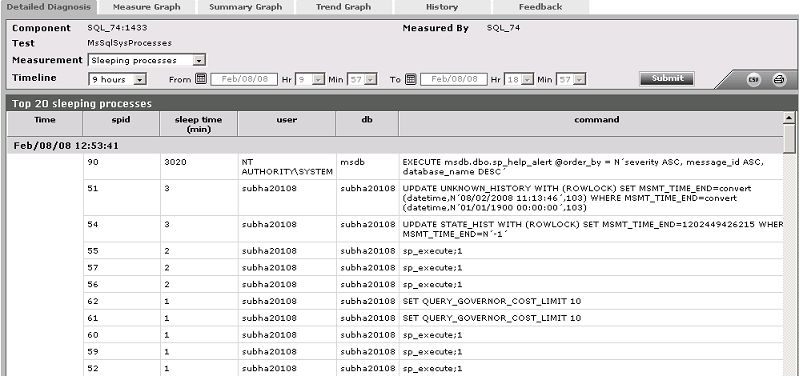
Figure 3 : The detailed diagnosis of the Sleeping processes measure
The detailed diagnosis of the Rollback processes measure, if enabled, reveals information such as the ID of the rolledback processes, the user executing each of the processes, the database on which every process is executing, etc. Rollbacks are expensive operations on a server. The detailed measures provided by eG in this regard, enable the user to isolate the specific queries that have rolledback. Further analysis of these queries can be performed, in order to figure out the reason for the rollback and take adequate measures to prevent it from recurring.
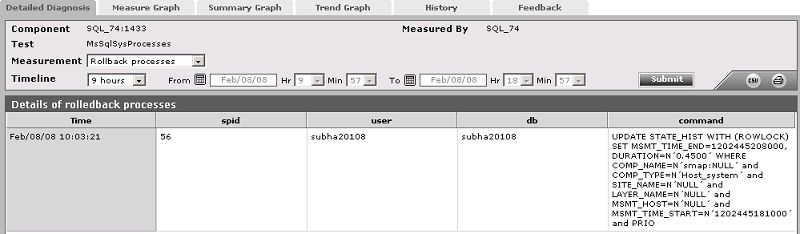
Figure 4 : The detailed diagnosis of the Rollback processes measure