SQL User Processes Test

This test reports the number and state of sessions of each user who is currently connected to the Microsoft SQL server. Using the metrics reported by this test, administrators can promptly isolate idle sessions and suspended sessions, which are a drain on a server’s resources.

Target of the test : A Microsoft SQL server

Agent deploying the test : An internal agent

Outputs of the test : One set of results for each user currently connected to the Microsoft SQL server monitored.

Configurable parameters for the test
  1. TEST PERIOD - How often should the test be executed
  2. Host – The IP address of the Microsoft SQL server.
  3. Port - The port number through which the Microsoft SQL server communicates. The default port is 1433.
  4. ssl – If the Microsoft SQL server being monitored is an SSL-enabled server, then set the ssl flag to Yes. If not, then set the ssl flag to No.
  5. instance - In this text box, enter the name of a specific Microsoft SQL instance that is to be monitored. The default value of this parameter is “default”. To monitor a Microsoft SQL instance named “CFS”, enter this as the value of the INSTANCE parameter.
  6. USER – If a Microsoft SQL Server 7.0/2000 is monitored, then provide the name of a SQL user with the Sysadmin role in this text box. While monitoring a Microsoft SQL Server 2005 or above, provide the name of a SQL user with all of the privileges outlined in User Privileges Required for Monitoring Microsoft SQL server.

  7. password - The password of the specified user.
  8. confirm password - Confirm the password by retyping it.
  9. domain - By default, none is displayed in the DOMAIN text box. If the ‘SQL server and Windows’ authentication has been enabled for the server being monitored, then the DOMAIN can continue to be none. On the other hand, if ‘Windows only’ authentication has been enabled, then, in the DOMAIN text box, specify the Windows domain in which the managed Microsoft SQL server exists. Also, in such a case, the USER name and PASSWORD that you provide should be that of a user authorized to access the monitored SQL server.
  10. isntlmv2 - In some Windows networks, NTLM (NT LAN Manager) may be enabled. NTLM is a suite of Microsoft security protocols that provides authentication, integrity, and confidentiality to users. NTLM version 2 (“NTLMv2”) was concocted to address the security issues present in NTLM. By default, the isntlmv2 flag is set to No, indicating that NTLMv2 is not enabled by default on the target Microsoft SQL host. Set this flag to Yes if NTLMv2 is enabled on the target host.
  11. ISPASSIVE – If the value chosen is yes, then the Microsoft SQL server under consideration is a passive server in a SQL cluster. No alerts will be generated if the server is not running. Measures will be reported as “Not applicable" by the agent if the server is not up.
  12. DETAILED DIAGNOSIS – To make diagnosis more efficient and accurate, the eG Enterprise embeds an optional detailed diagnostic capability. With this capability, the eG agents can be configured to run detailed, more elaborate tests as and when specific problems are detected. To enable the detailed diagnosis capability of this test for a particular server, choose the On option. To disable the capability, click on the Off option.The option to selectively enable/disable the detailed diagnosis capability will be available only if the following conditions are fulfilled:
  • The eG manager license should allow the detailed diagnosis capability

  • Both the normal and abnormal frequencies configured for the detailed diagnosis measures should not be 0.

Measurements made by the test
Measurement Description Measurement Unit Interpretation

Total processes:

Indicates the total number of sessions currently open on the server for this user.

Number


Running processes:

Indicates the number of sessions of this user that are currently active.

Number

The detailed diagnosis of this measure, if enabled, will provide the complete details of the active sessions of a particular user. Using this information, you can understand how each of the connections were made - i.e., using which program - and from where - i.e., from which host.

Sleeping processes:

Indicates the number of sessions initiated by this user that are currently idle.

Number

Ideally, the value of this measure should be low. A high value is indicative of a large number of idle sessions, which in turn causes the unnecessary consumption of critical server resources. Idle sessions also unnecessarily lock connections from the connection pool, thereby denying other users access to the server for performing important tasks.

The detailed diagnosis of this measure, if enabled, will provide the complete details of the idle sessions of a particular user. Using this information, you can understand how each of the idle connections were made - i.e., using which program - and from where - i.e., from which host.

Suspended processes:

Indicates the number of sessions initiated by this user that are currently suspended.

Number

A session can switch to a suspended state if one/more processes triggered in that session could not continue executing; a possible reason for this could be that the processes are waiting for blocked rows or a blocked table to be released.

The detailed diagnosis of this measure, if enabled, will provide the complete details of the suspended sessions of a particular user.

Background processes:

Indicates the number of background processes currently running for this user.

Number

The detailed diagnosis of this measure, if enabled, provides the details pertaining to the background processes currently executing.

The detailed diagnosis of the Sleeping processes measure, if enabled, will provide the complete details of the idle sessions of a particular user. Using this information, you can understand how each of the idle connections were made - i.e., using which program - and from where - i.e., from which host.

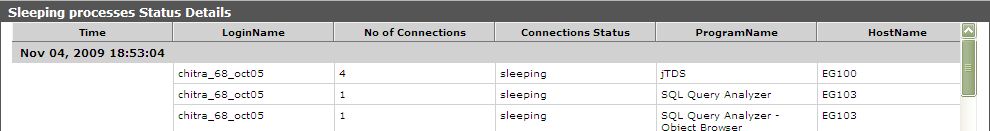
Figure 1 : The detailed diagnosis of the Sleeping processes measure