Monitoring Macintosh OS
Log into the eG monitoring interface for viewing the current state of the managed macOS component and the performance statistics it reports.
In the eG monitoring console, eG Enterprise uses a specialized macOS monitoring model to represent the real-time state of the macOS.
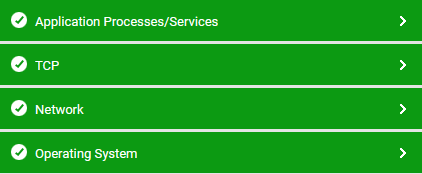
Figure 1 : The layer model of a Macintosh OS
These tests track the status of host devices, processes, storage, and user activity. Using the measures reported by these tests, administrators can find quick and accurate answers to the following performance queries:
-
Are the devices that are accessible via the server operating normally? If not, what is the number of errors associated with the device?
-
Are there too many processes executing on the server?
-
Are the processes utilizing too much CPU and memory?
-
What is the percentage utilization of CPU by the processors?
-
Is the server experiencing any storage crunch?
-
Are there too many users and processes accessing the server? If, so then how many?
These layers are similar to the Open VMS Server monitoring model; hence,