Maria SQL Network Test
This test monitors the availability and responsiveness of the Maria Database server by emulating a client connecting and executing queries on the Maria Database server.
Target of the test : A Maria Database server
Agent deploying the test : An external agent
Outputs of the test : One set of results for the Maria Database server being monitored
| Parameter | Description |
|---|---|
|
Test Period |
How often should the test be executed. |
|
Host |
The IP address of the Maria Database server. |
|
Port |
The port on which the server is listening. |
|
Database |
Specify the name of the database that is to be monitored on the target Maria Database server. |
|
User and Password |
The eG agent has to be configured with the credentials of a user who has server-wide PROCESS and SELECT privileges on the monitored Maria Database server. To know how to create such a user, refer to Configuring the eG Agent with Access Privileges |
|
Confirm Password |
Confirm the password by retyping it here. |
|
SSL |
This indicates that the eG agent will communicate with the Maria Database via HTTPS or not. By default, this flag is set to No, as the target Maria database is not SSL-enabled by default. If the target database is SSL-enabled, then set this flag to Yes. |
|
Verify CA |
If the eG agent is required to establish an encrypted connection with the target Maria Database server by authenticating the server's identity through verifying the server CA certificate, set Verify CA flag to Yes. By default, this flag is set to No. |
|
Detailed Diagnosis |
To make diagnosis more efficient and accurate, the eG Enterprise embeds an optional detailed diagnostic capability. With this capability, the eG agents can be configured to run detailed, more elaborate tests as and when specific problems are detected. To enable the detailed diagnosis capability of this test for a particular server, choose the On option. To disable the capability, click on the Off option. The option to selectively enable/disable the detailed diagnosis capability will be available only if the following conditions are fulfilled:
|
| Measurement | Description | Measurement Unit | Interpretation |
|---|---|---|---|
|
Maria server Availability |
Indicates whether the database instance is responding to requests. |
Percent |
The availability is 100% when the instance is responding to a request and 0% when it is not. Availability problems may be caused by a misconfiguration/malfunctioning of the database instance, or because the instance is using an invalid user account. Besides the above, this measure will report that the server is unavailable even if a connection to the database instance is unavailable, or if a query to the database fails. In this case, you can check the values of the DB connection availability and Query processor availability measures to know what is exactly causing the database instance to not respond to requests - is it owing to a connection unavailability? or is it due to a query failure? |
|
Connection time |
Indicates the time taken by the database connection. |
Secs |
A high value could indicate a connection bottleneck. Whenever the Total response time of the measure soars, you may want to check the value of this measure to determine whether a connection latency is causing the poor responsiveness of the server. |
|
Database connection availability |
Indicates whether the database connection is available or not. |
Percent |
If this measure reports the value 100 , it indicates that the database connection is available. The value 0 on the other hand indicates that the database connection is unavailable. A connection to the database may be unavailable if the database is down or if the database is listening on a port other than the one configured for it in the eG manager or owing to a poor network link. If the Oracle server availability measure reports the value 0, then, you can check the value of this measure to determine whether/not it is due to the unavailability of a connection to the server. |
|
Statement availability |
Indicates whether the database query is executed successfully or not. |
Percent |
If this measure reports the value 100, it indicates that the query executed successfully. The value 0 on the other hand indicates that the query failed. In the event that the Maria server availability measure reports the value 0, check the value of this measure to figure out whether the failed query is the reason why that measure reported a server unavailability. |
|
Statement execution time |
Indicates the time taken for query execution. |
Secs |
A high value could indicate that one/more queries to the database are taking too long to execute. Inefficient/badly designed queries to the database often take too long to execute. If the value of this measure is higher than that of the Connection time measure, you can be rest assured that long running queries are causing the respond slowly to requests. |
|
No of records |
Indicates the number of records fetched from the database. |
Number |
The value 0 indicates that no records are fetched from the database. |
|
Response time |
Indicates the time taken by the database to respond to a user query. This is the sum total of the connection time and query execution time. |
Secs |
A sudden increase in response time is indicative of a bottleneck at the database server. This could even be owing to a connection delay and/or long running queries to the database. Whenever the value of this measure is high, it would be good practice to compare the values of the Connection time and Query execution time measures to zero-in on the root-cause of the poor responsiveness of the server - is it because of connectivity issues? or is it because of inefficient queries? |
The detailed diagnosis of the Total response time measure, if enabled, reveals the top ten resource consuming queries to the database. Resource consumption is reported in terms of disk reads, buffer gets, number of loads, execution cycles, rows processed, etc. Using this information, you can identify the non-optimal queries that could impact the database performance adversely (see Figure 1).
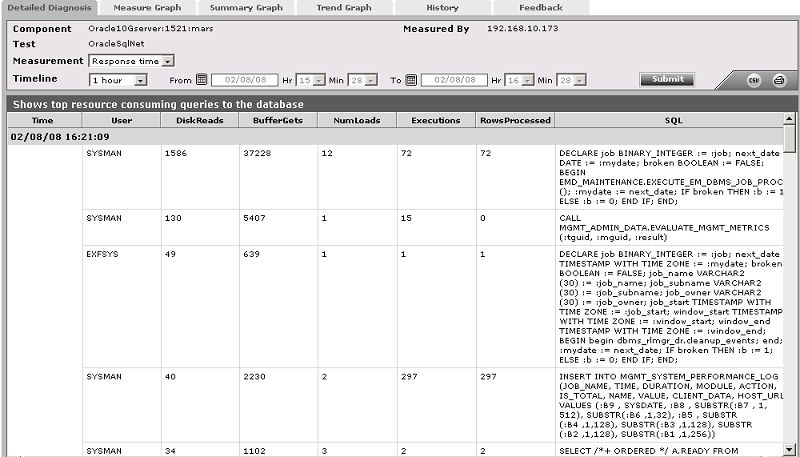
Figure 1 : Detailed diagnosis of the Response time measure displaying the top 10 resource consuming queries