Adding Memcached
eG Enterprise cannot auto-discover Memcached caching system. This implies that you need to manually add the component for monitoring. The steps for manually adding the Memcached caching system component are detailed below:
- Login to the eG admin interface as user with administrative privileges.
- Follow the Infrastructure -> Components -> Add/Modify Component menu sequence in the Admin tile menu.
- From the page that appears, select Memcached as the Component type and click the Add New Component button.
-
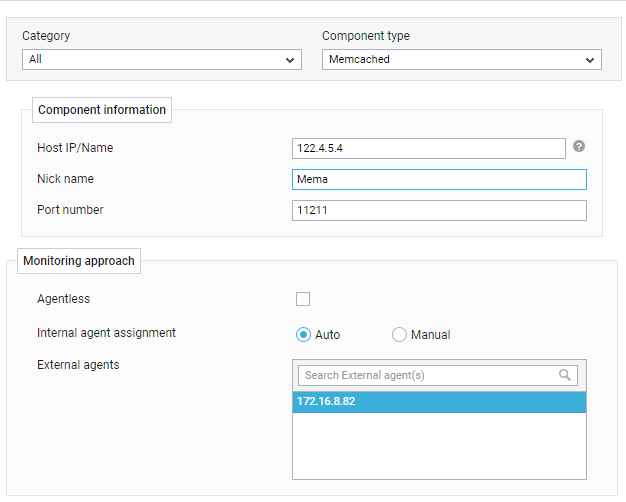
Figure 1 will then appear.
-
In Figure 1, provide the Host IP/Name of the Memcached caching system to be monitored. Then, provide a Nick name for the server.
- By default, the Auto option will be selected against the Internal agent assignment field. This indicates that by default, eG Enterprise maps every configured IP/nick name with a separate internal agent. To manually define the IP-internal agent association, select the Manual option.
- Pick an external agent from the External agents list box and click the Add button to add the component for monitoring.
-
Once the Memcached component is added successfully, you will be again redirected to Figure 2. Using the options provided in the page that appeared, you can modify, unmanage or delete the newly added component. In addition, you can also configure the tests, set thresholds and maintenance policies, and change the IP address.

-
To collect the performance metrics, you may need to manually configure the tests that are mapped to the Memcached caching system. To configure the tests that need manual configuration, click on the
 icon in Figure 2. This will lead you to the Specific Test Configuration page where the unconfigured tests for the Memcached caching system will be listed in the Unconfigured Tests list box.
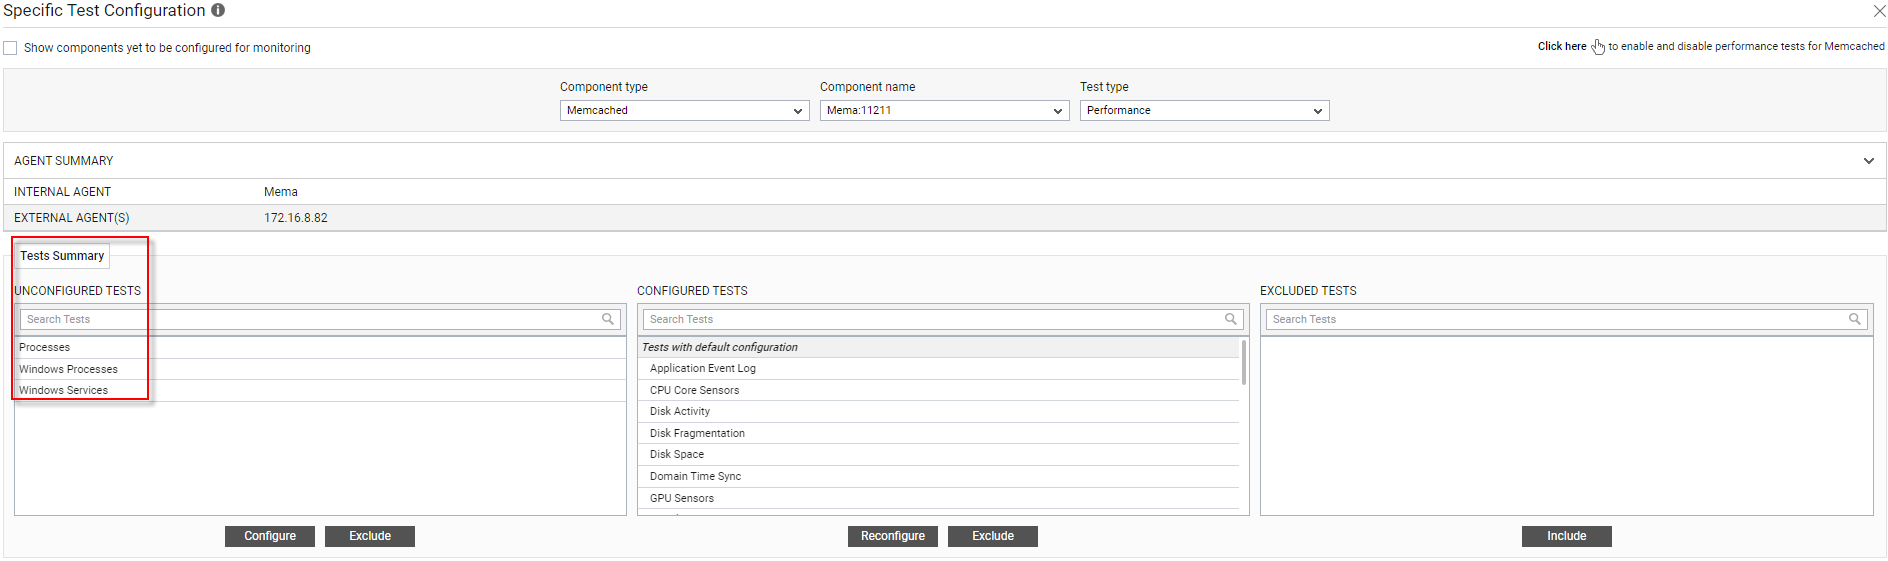
Figure 3 : The list of unconfigured tests for the Memcached component
-
The tests specific to Memcached will be listed in CONFIGURED TEST list box.
-
To configure Processes and Windows Services tests, refer to Monitoring Unix and Windows Servers.
-
Once all the tests are configured, switch to the Monitor tab to view the performance metrics reported by the tests.