Configuring the Host Pool Logs to be Sent to a Log Analytics Workspace
It is recommended that you create a new Log Analytics Workspace for monitoring purposes, and send all the logs that eG monitors to that workspace. If such a workspace pre-exists, then proceed to set that workspace as the destination for the host pool logs. To achieve this, use steps 5-10 of the procedure detailed below. If no such workspace is available, then do the following:
-
Use steps 1-4 of the procedure discussed below to create a new log analytics workspace.
-
Then, use steps 5-12 of the procedure to configure the logs of all monitored host pools to be sent to the new workspace you created.
-
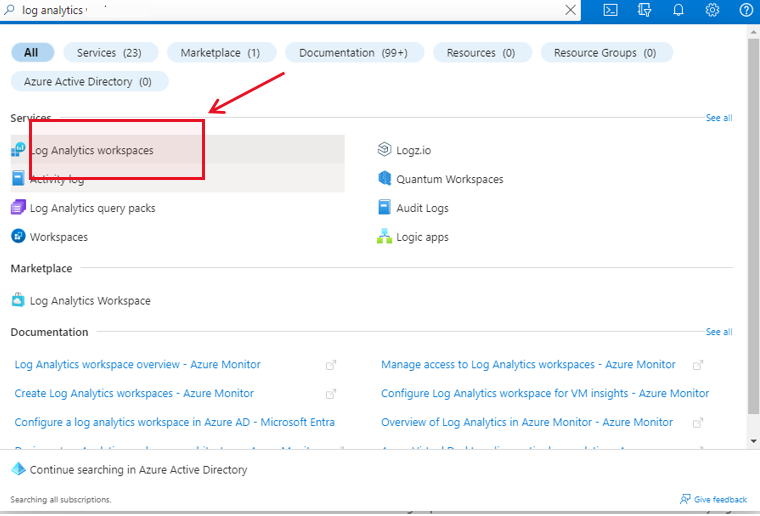
To create a new Log Analytics Workspace, first, login to the Microsoft Azure Portal, and use the Search text box therein to search for the string 'log analytics'. The Log Analytics Workspace option will then appear in the sear\\\ch results (see Figure 1). Click on that option.
-
Figure 2 will then appear. If one/more Log Analytics Workspaces pre-exist, then Figure 2 will reveal them. To create a new workspace, click on the Create link indicated by Figure 2.
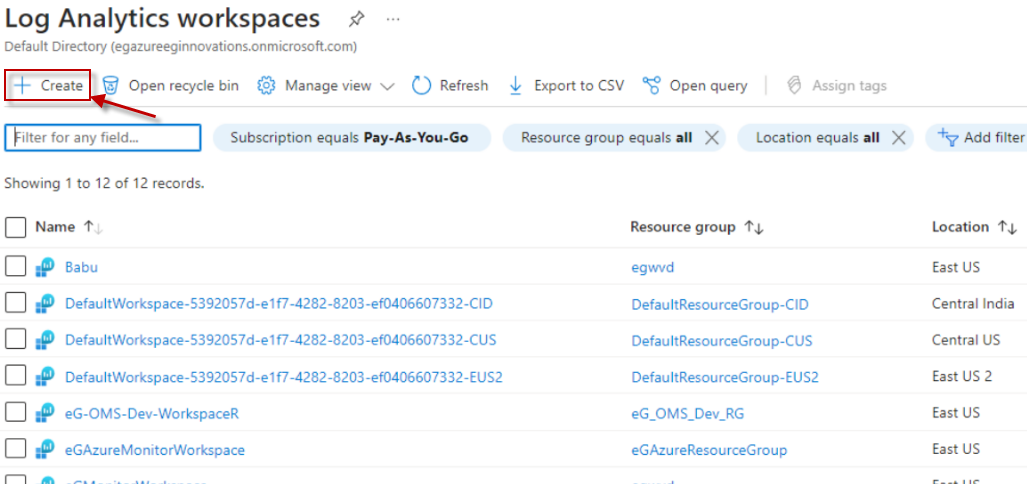
Figure 2 : Clicking on the Create link in the Log Analytics Workspaces window
-
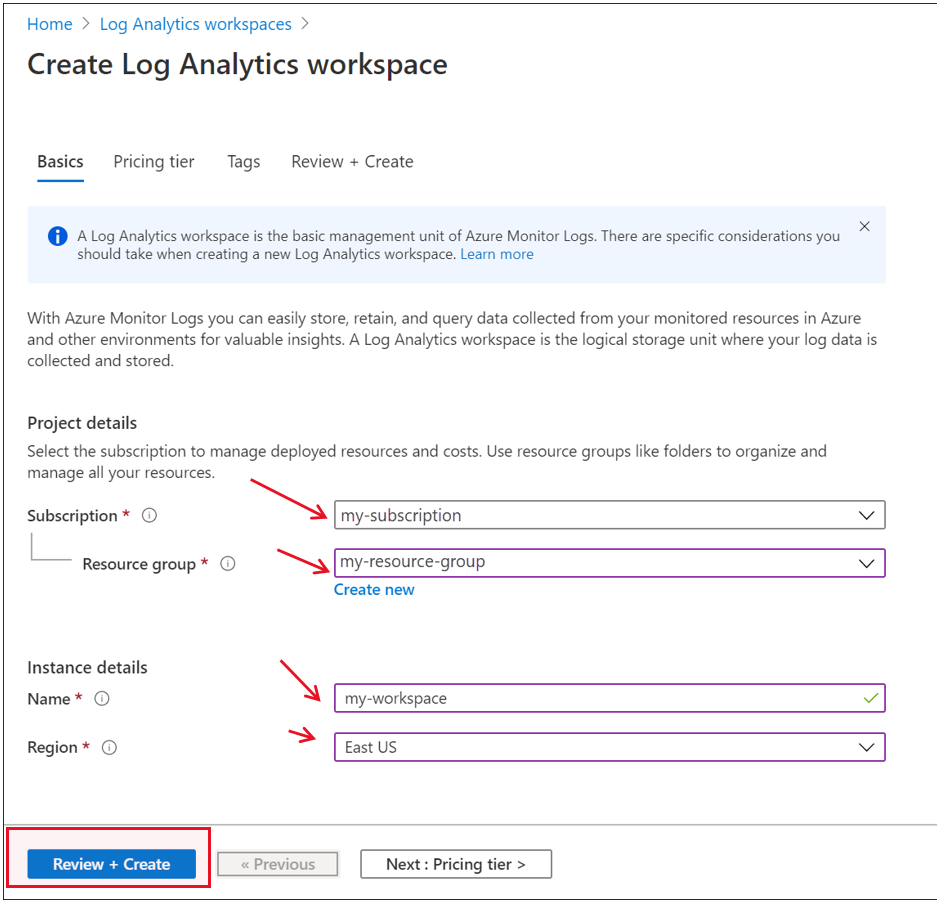
Doing so will invoke Figure 3. From the Subscription drop-down in Figure 3, select the Azure Subscription for which the new workspace is being created. This should be the Microsoft Azure Subscription that you are monitoring. Next, select the Resource Group to which the chosen subscription belongs, and its Region. Finally, specify Name of the new Log Analytics Workspace.
-
Finally, click the Review + Create button to add the new log analytics workspace.
-
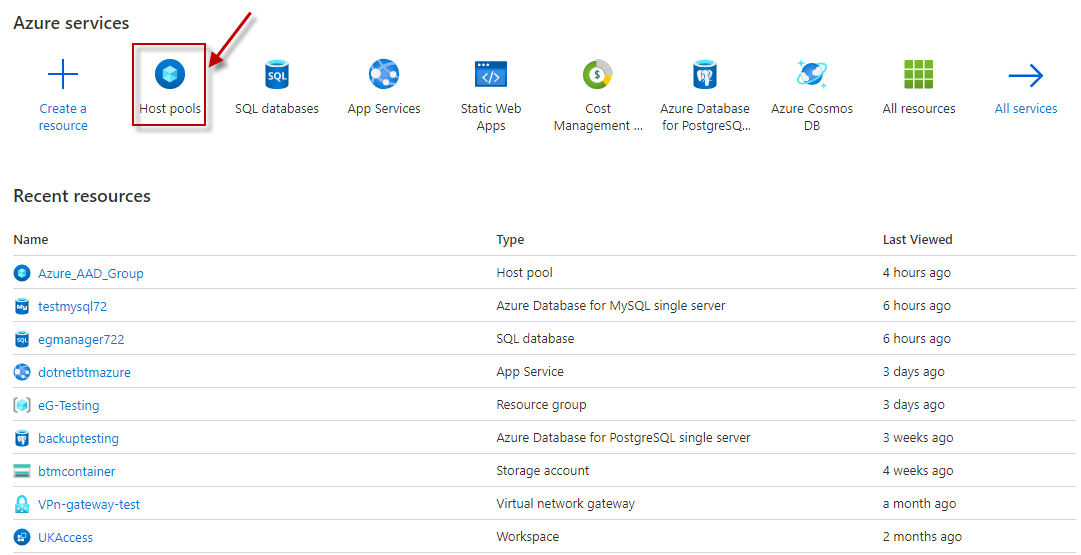
Now, proceed to set this workspace as the destination for the host pool logs. For this, click on the Host pools option as indicated by Figure 2. The existing host pools will be listed below. Click on any of the host pools.
-
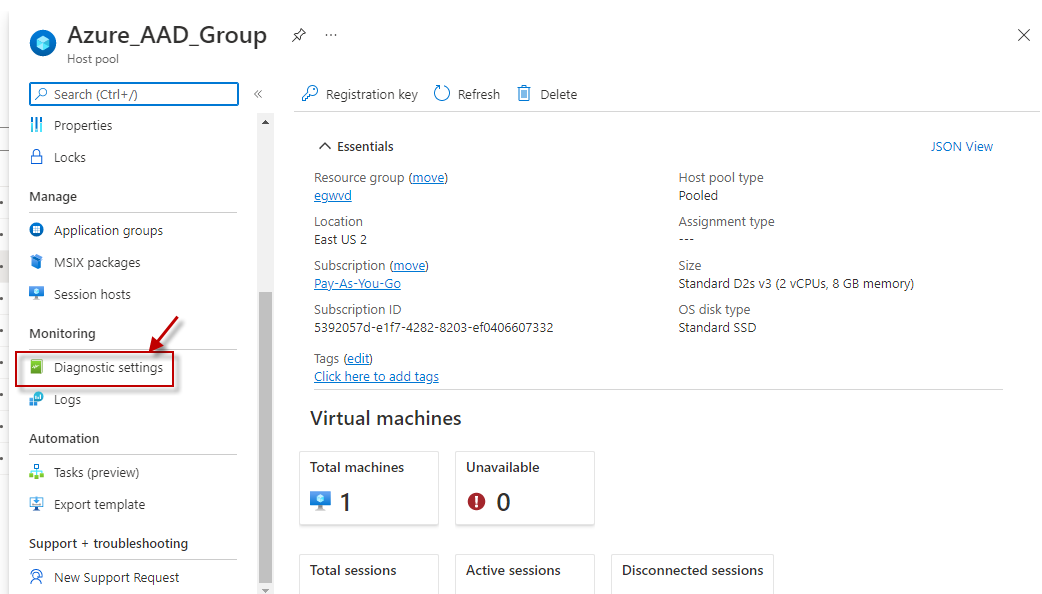
Figure 5 will then appear displaying the properties of the host pool. Keep scrolling down the left panel of Figure 5, until a Monitoring section comes into view. Click on the Diagnostic Settings option under Monitoring (see Figure 5).
-
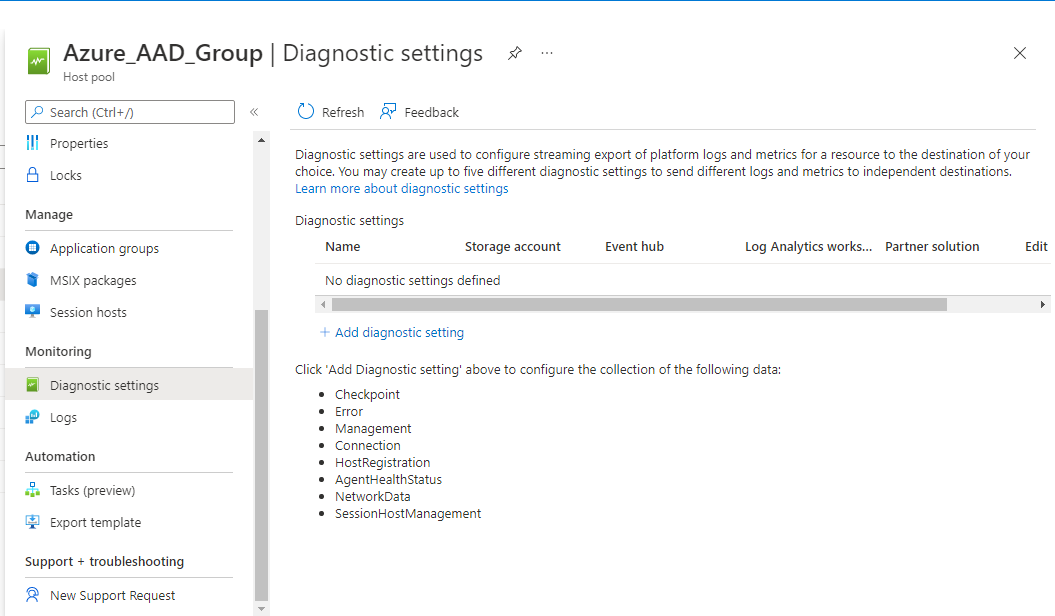
Use the Diagnostics setting page that then appears to configure the logs that are to be collected (see Figure 7).
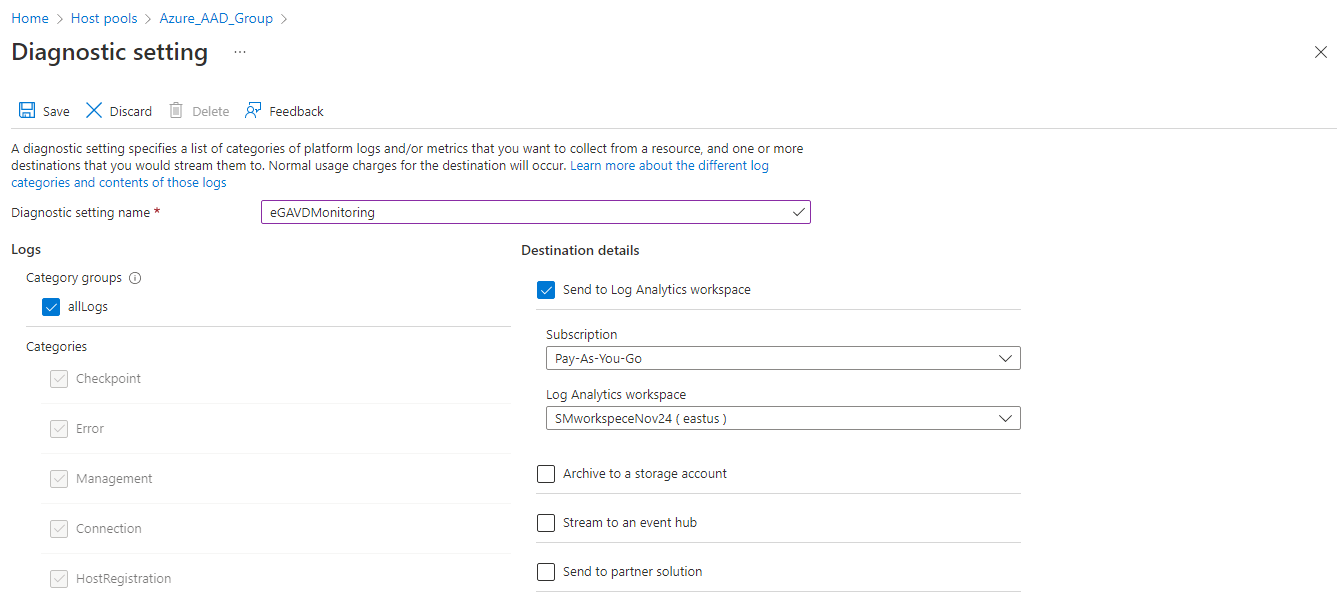
Figure 7 : Adding a diagnostic setting for the chosen host pool
-
To add a diagnostic setting for the chosen host pool, first, provide a unique Diagnostic setting name.
-
Then, under Log, select the allLogs check box, so that all activities related to the chosen host pool are logged.
-
Next, select the Send to Log Analytics workspace check box , and then pick the Log Analytics workspace to which the logs are to be sent. Ensure that you either select the Log Analytics workspace that you created earlier in this procedure, or that Log Analytics workspace that you have used as the destination for all other logs that eG monitors.
-
Finally, to save the configuration, click on the Save button.
-
Make sure that you repeat steps 5-12 for every AVD host pool that you want monitored.