Monitoring App-V Client
eG Enterprise provides a 100%, web-based App-V Client monitoring model that periodically checks the availability and responsiveness of the APP-V Publishing server, monitors the CPU, memory and resource utilization of each application that is published on the client, and sends out proactive alerts to administrators if abnormalities are sensed in any of the monitored activities.
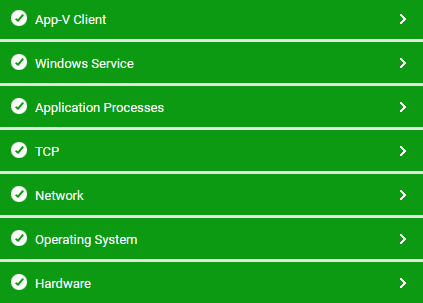
Figure 1 : The layer model of the APP-V Client
Using the metrics reported , administrators can find quick and accurate answers for the following performance questions:
- What is the size of each application published on the App-V Client?;
- Is the application loading and what percentage of the application has been loaded currently?;
- What is the resource utilization – in terms of memory, CPU, etc of each application?;
- Is the App-V Publishing server available?;
- How many events were generated for the Client Amin Log and what are they?;
- How many events were generated for the Client Operations Log and what are they?;
- How many events were generated for the Client Virtual Application Log and what are they? etc.
The Hardware, Operating System, Network, TCP and Application Processes layers of the App-V Client monitoring model is similar to that of a Windows server model. Refer to the Hardware Monitoring by eG Enterprise to know more about the tests pertaining to the Hardware layer and the Unix and Windows Servers