Monitoring Microsoft AppFabric Caching
eG Enterprise offers a specialized monitoring model for the Microsoft AppFabric Caching (see Figure 1) that monitors the cache 24 x 7 and proactively alerts administrators of probable issues in its operations, so that issues are trapped very early and resolved before its too late.
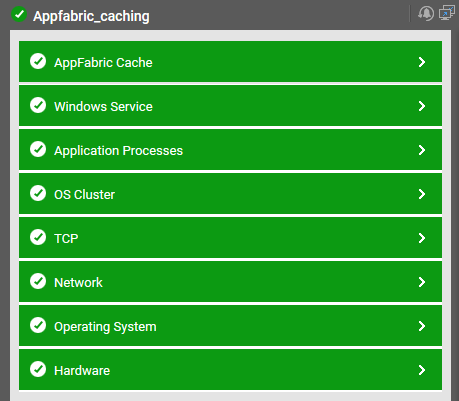
Figure 1 : Layer model of the Microsoft AppFabric Caching
Each of the layers depicted by the hierarchical model above, is associated with a wide variety of tests that measures the performance of the Microsoft AppFabric Caching. The performance metrics reported by these tests shed light on the following:
- How many requests were not serviced by each cache?
- What is the total size of the cached data in each cache?
- What is the total size of the primary cached data in each cache?
- What is the total size of the secondary cached data in each cache?
- How many objects were stored in each cache?
- How many read requests were received by each cache since the start of the cache service?
- How many write requests were received by each cache since the start of the cache service?
- How many GetAndLock requests were received per second by each cache?
- How many GetAnd Lock requests were successful on each cache?
- What is the average quorum response time on the primary host?
- What is the average time spent to get response from the secondary servers?
- How many expired objects and evicted objects are available in the primary host?
- What is the total size of the primary cached data?
- How many retry operation exceptions were performed on the primary host since the start of the cache service?
- How many Get requests were received from all clients on the primary host since the start of the cache service?
- How many read/write requests were received from all clients since the start of the cache service?
- How many objects were stored in the host?
- How many times the replication operation was retried on the secondary cache server?