Configuring the Sign-in Logs to be Sent to a Log Analytics Workspace
It is recommended that you create a new Log Analytics Workspace for monitoring purposes, and send all the logs that eG monitors to that workspace. If such a workspace pre-exists, then proceed to set that workspace as the destination for Sign-in logs. To achieve this, use steps 5-10 of the procedure detailed below. If no such workspace is available, then do the following:
-
Use steps 1-4 of the procedure discussed below to create a new log analytics workspace.
-
Then, use steps 5-10 of the procedure to configure the sign-in logs to be sent to the new workspace you created.
-
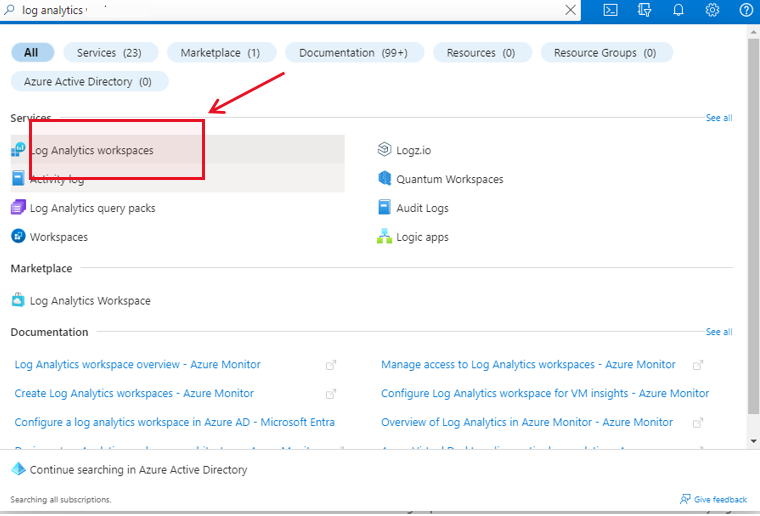
To create a new Log Analytics Workspace, first, login to the Microsoft Azure Portal, and use the Search text box therein to search for the string 'log analytics'. The Log Analytics Workspace option will then appear in the sear\\\ch results (see Figure 356). Click on that option.
-
Figure 357 will then appear. If one/more Log Analytics Workspaces pre-exist, then Figure 357 will reveal them. To create a new workspace, click on the Create link indicated by Figure 357.
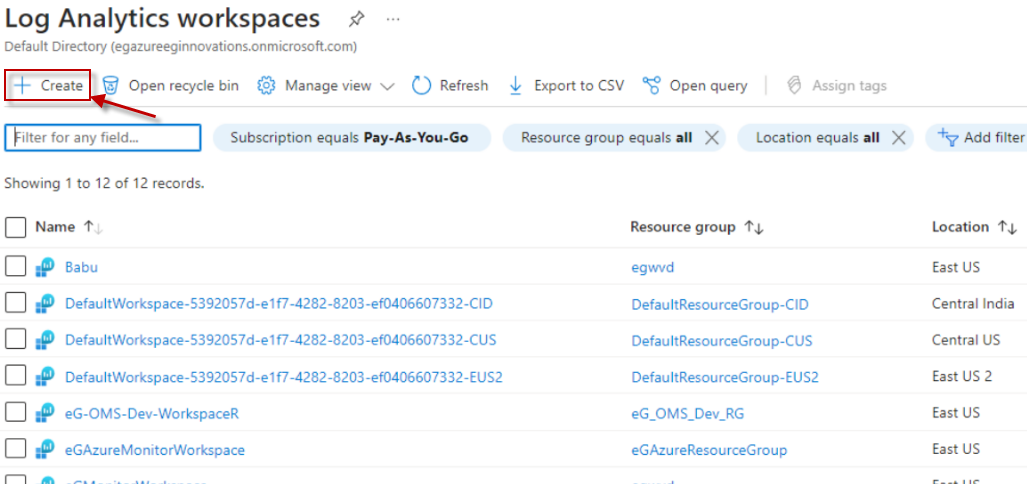
Figure 357 : Clicking on the Create link in the Log Analytics Workspaces window
-
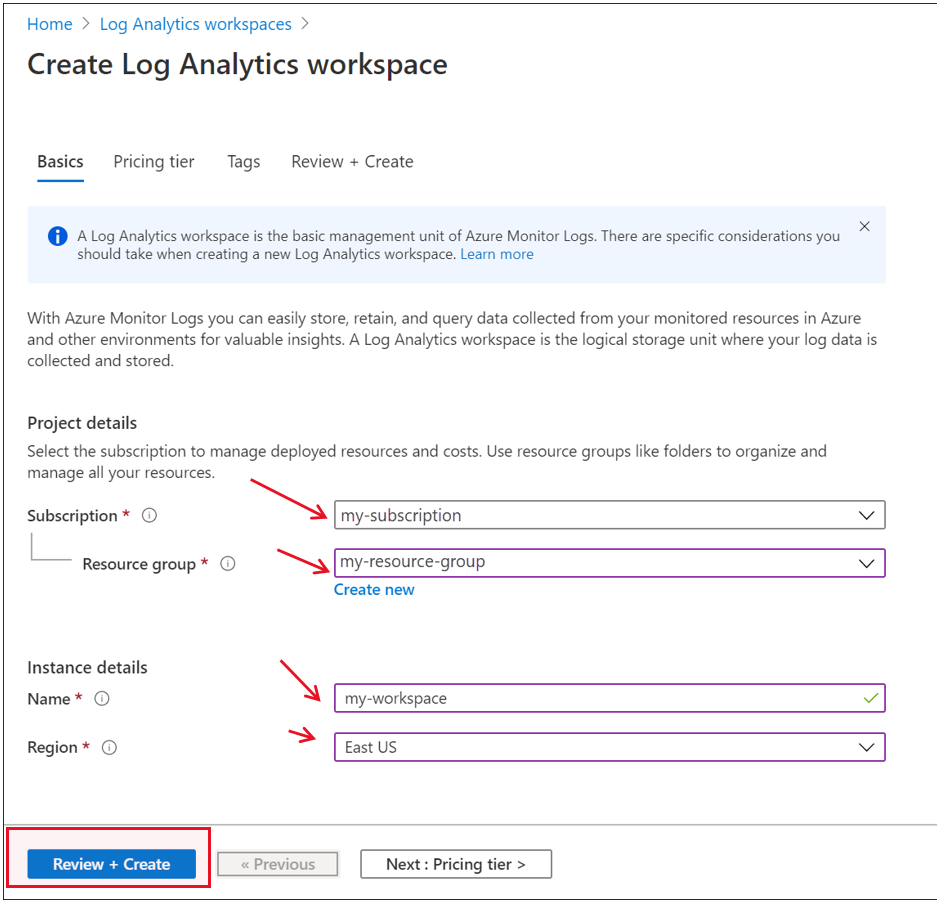
Doing so will invoke Figure 358. From the Subscription drop-down in Figure 358, select the Azure Subscription for which the new workspace is being created. This should be the Microsoft Azure Subscription that you are monitoring. Next, select the Resource Group to which the chosen subscription belongs, and its Region. Finally, specify Name of the new Log Analytics Workspace.
-
Finally, click the Review + Create button to add the new log analytics workspace.
-
Now, proceed to set this workspace as the destination for the sign-in logs. For this, select the Sign-in Logs option (see Figure 359).
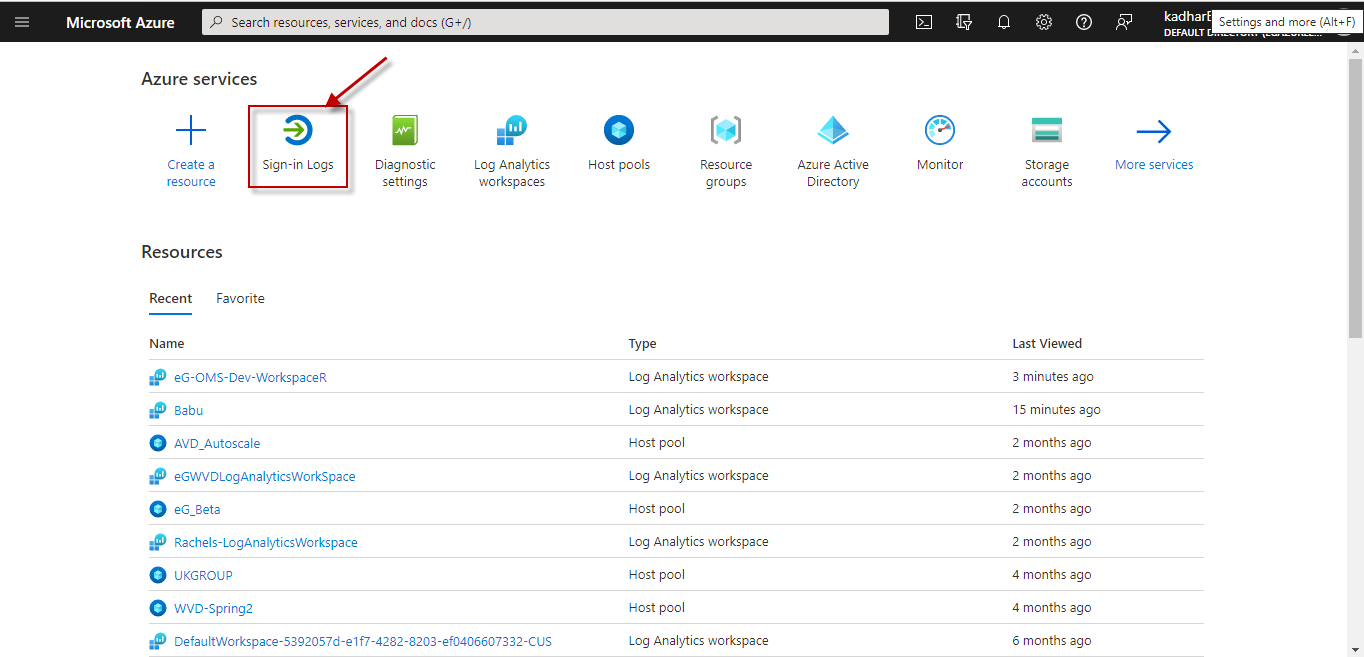
Figure 359 : Selecting theSign-in Logs option
-
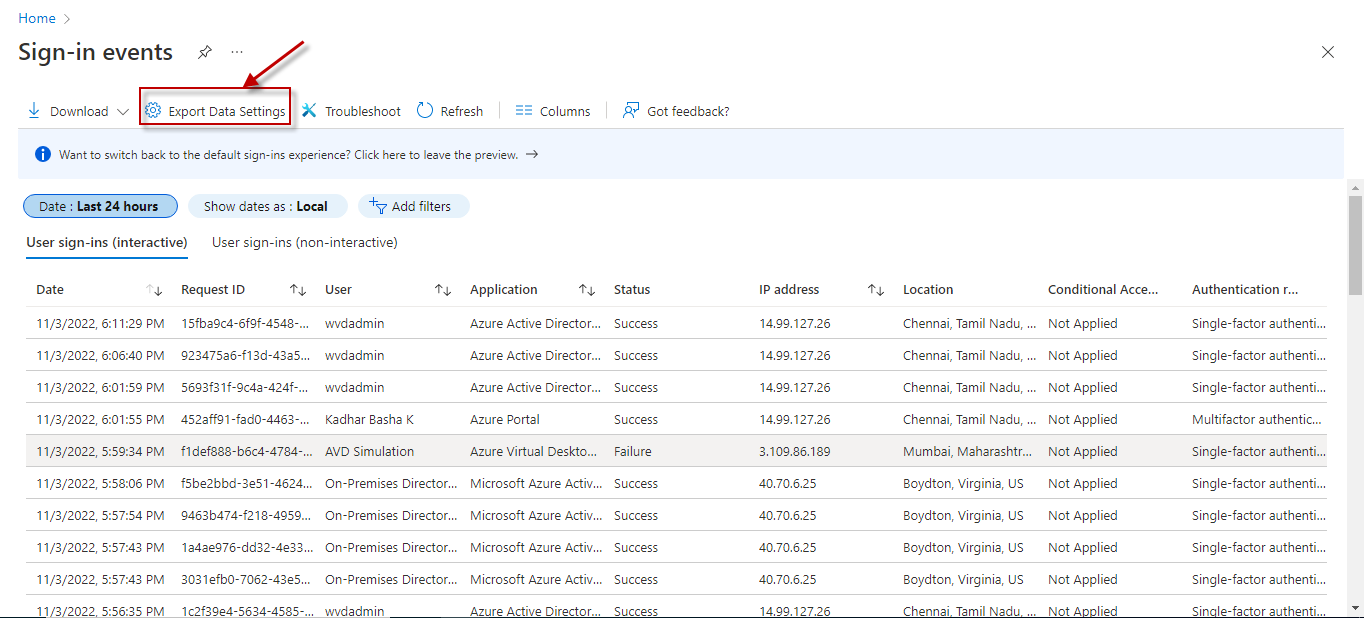
Figure 360 will then appear listing the log entries. Next, proceed to configure a diagnostic setting for sending the Sign-in logs to a Log Analytics Workspace. For that, click on the Export Data settings button indicated by Figure 360.
-
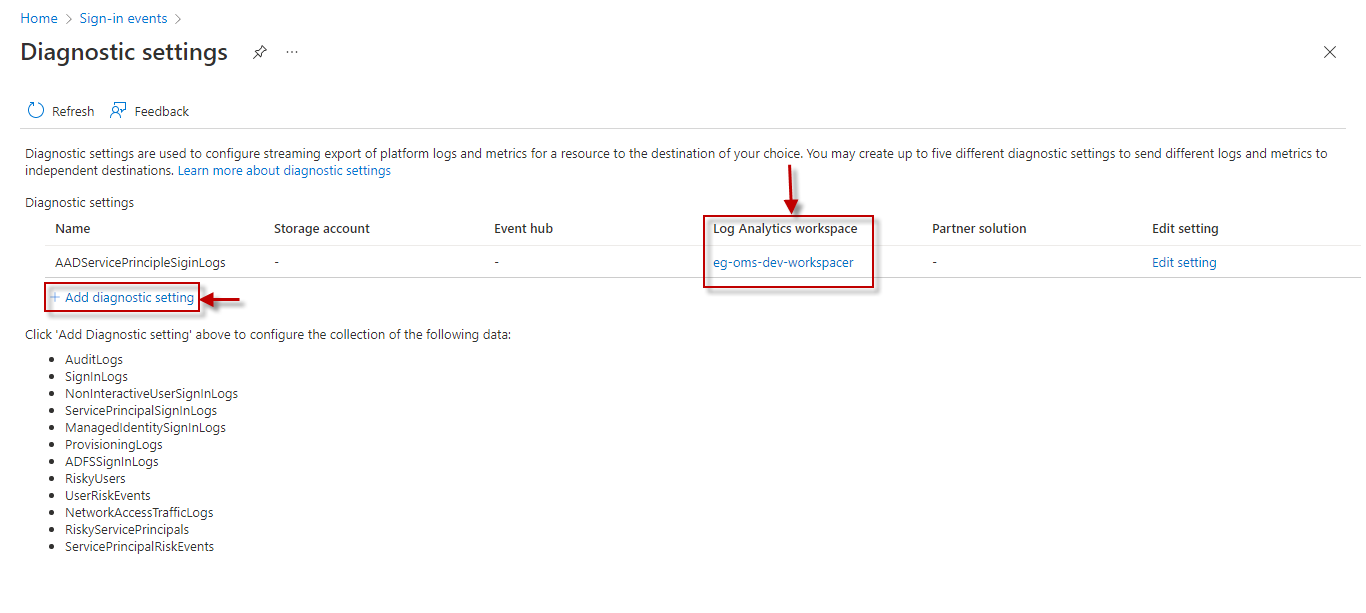
Figure 361 will then appear. The diagnostic settings for the sign-in logs will then appear. If any of the existing diagnostic settings have already been configured with Log Analytics Workspaces, then Figure 361 will display these workspace names and the diagnostic settings they map to. However, If the Log Analytics workspace column in Figure 361 is blank for all the existing diagnostic settings, it is a clear indication that the sign-in logs are yet to be configured to be sent to any Log Analytics Workspace. In this case therefore, you should create a new diagnostic setting, where a Log Analytics Workspace is configured as the destination for sign-in logs. To achieve this, click on the Add diagnostic setting button in Figure 361.
-
In Figure 362 that appears next, first specify the Diagnostic setting name. Then, select the Categories of events you want logged by clicking on the corresponding check boxes. To make sure that this test report valid values for all measures, select the checkboxes indicated by . Then, from the Destination details section, select Send to Log Analytics workspace.
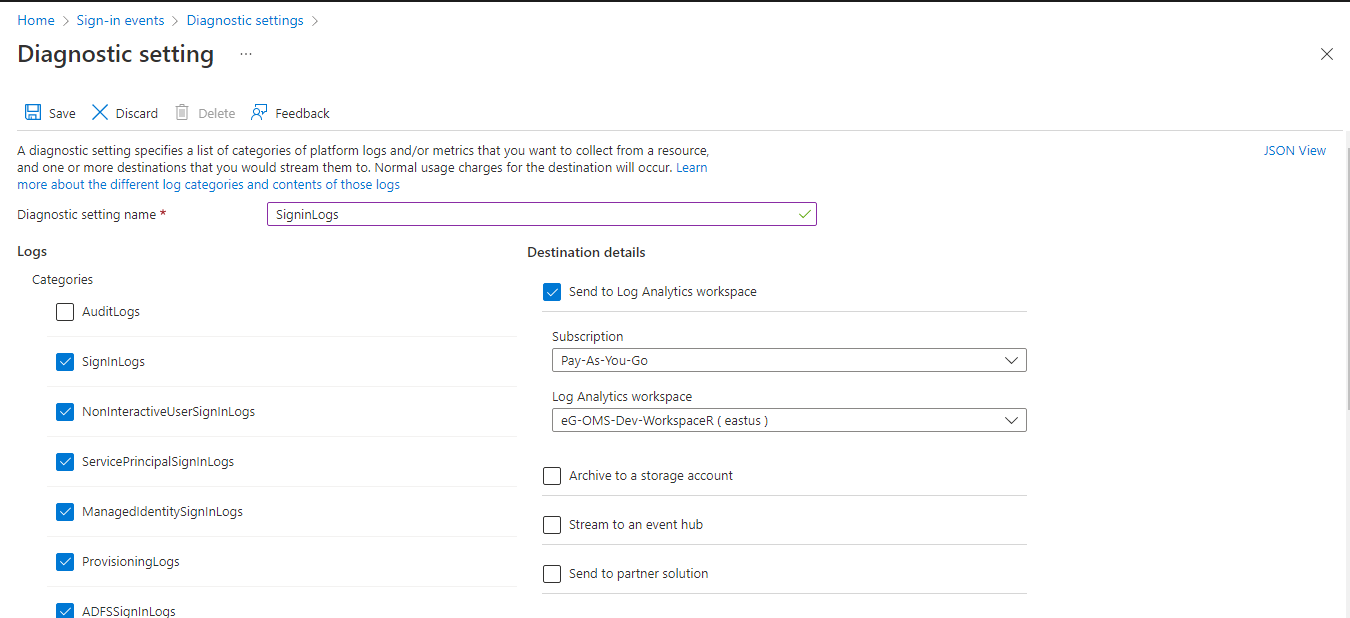
Figure 362 : Configuring a diagnostic setting for sending the Sign-in logs to a Log Analytis Workspace
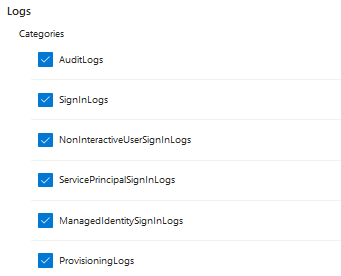
Figure 363 : The Categories of logs that are to be sent to the Log Analytics Workspace
-
Upon selecting this option, you will be required to select the Subscription for which this diagnostic setting applies and the Log Analytics workspace to which the Sign-in logs have to be sent. Make sure that you select the Azure subscription being monitored from the Subscription drop-down. Also, ensure that you either select the Log Analytics workspace that you created earlier in this procedure, or that Log Analytics workspace that you have used as the destination for all other logs that eG monitors.
-
Finally, to save the configuration, click on the Save button in Figure 362.