Installing and Configuring the .NET Profiler on Azure
To install the .NET profiler on Azure, follow the steps below:
-
Login to the Azure portal.
-
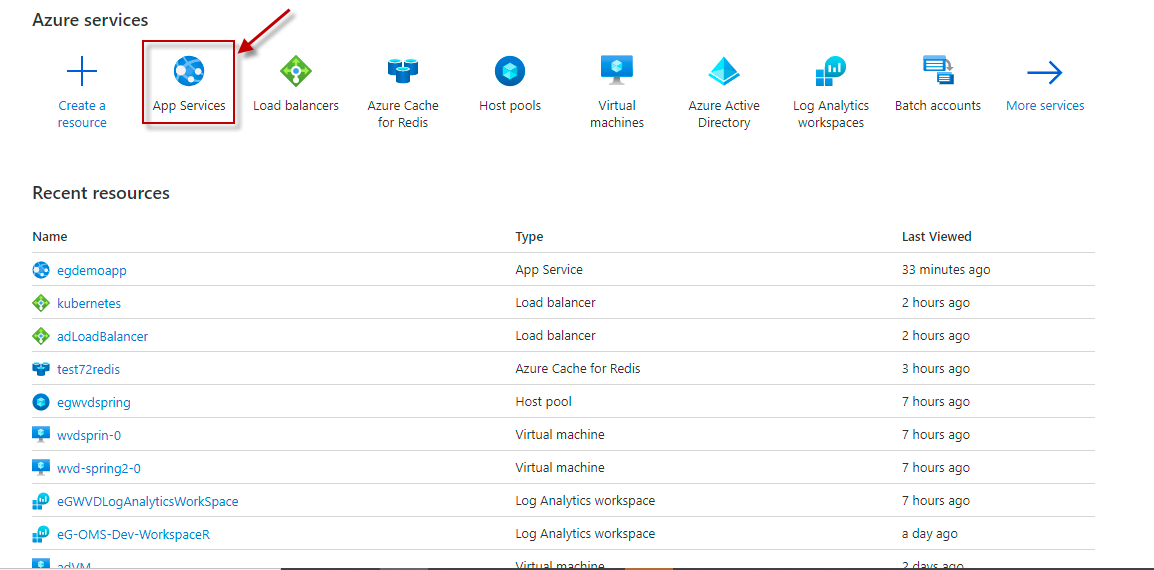
Figure 1 then appears. From the options listed at the top of Figure 1, select App Services, as indicated.
-
Figure 2 will then appear listing the web applications deployed on the App Services platform. To deploy the .NET profiler, first locate the .NET application in the list of applications in Figure 2, and then click on it.
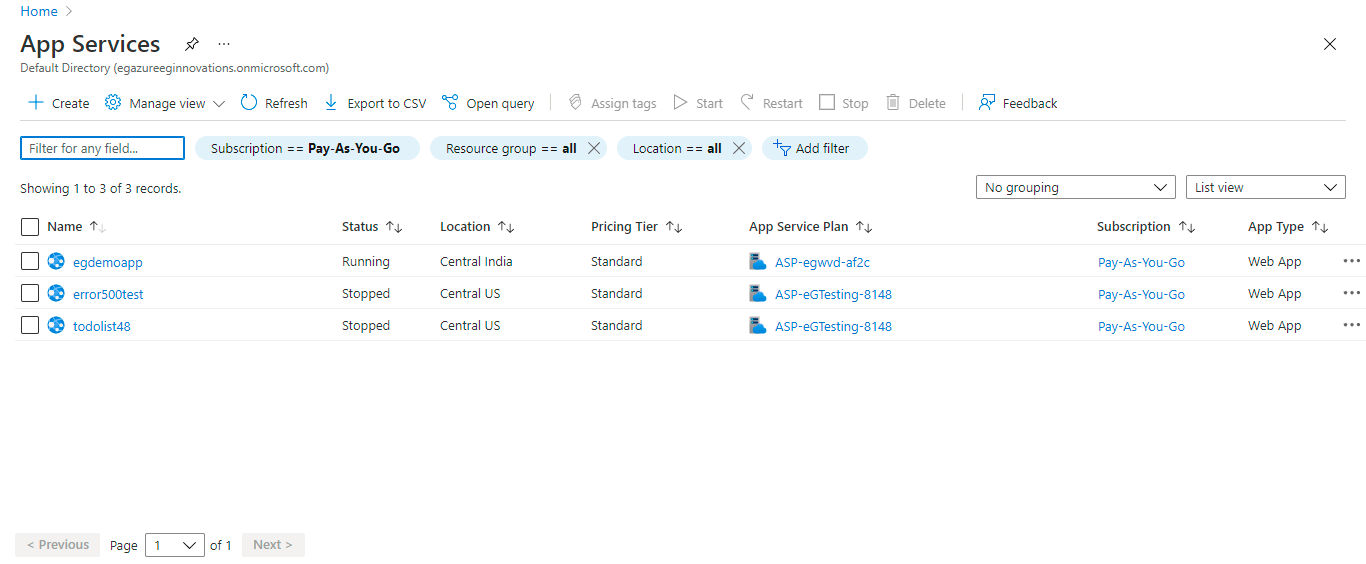
Figure 2 : Click on the .NET application deployed on the App Services platform
-
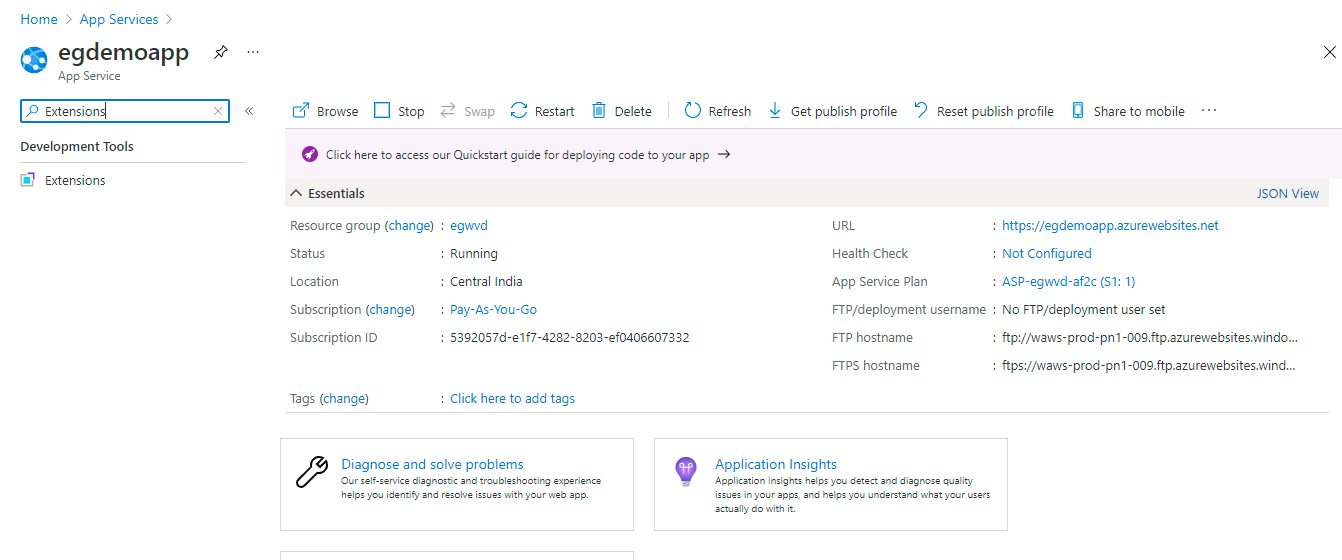
Figure 3 will then appear. Keep scrolling down the options listed in the left pane of Figure 3, until you find the Extensions option. Alternatively, you can type Extensions in the Search text box at the top of the left pane. Doing so, will automatically take you to the Extensions option. Once this option becomes visible, click on it.
-
Upon selecting the Extensions option from the left pane, the right panel will change to display the list of Extensions that pre-exist (if any). To add a new extension, click on the Add button in the right panel (see Figure 4).
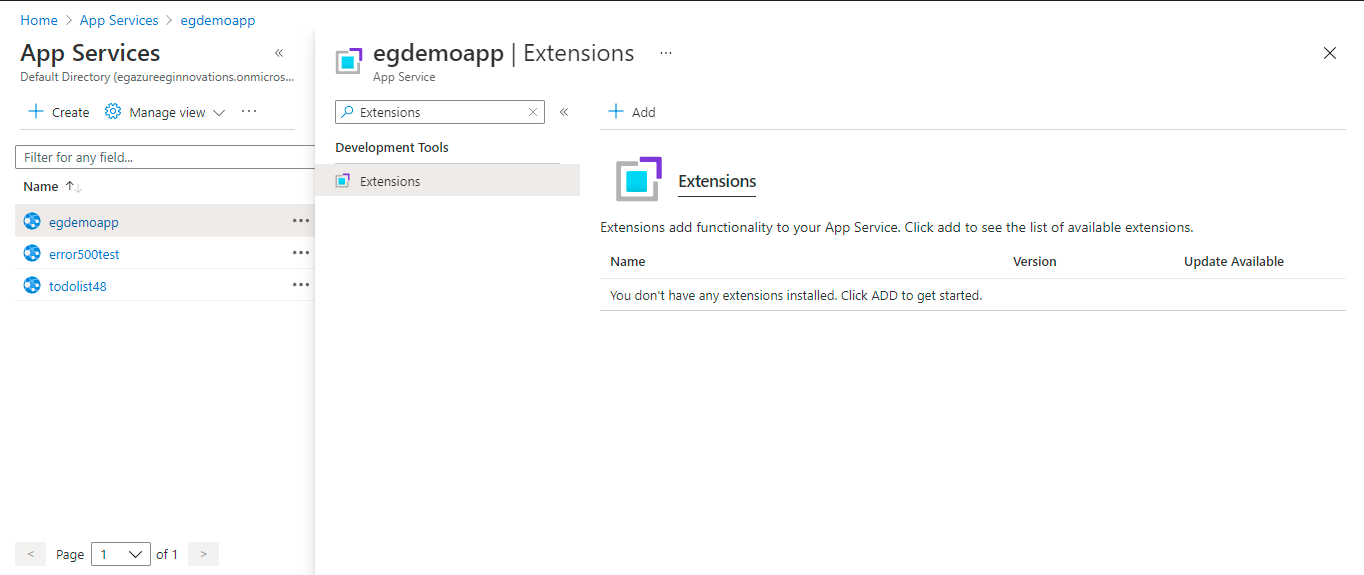
Figure 4 : Clicking on the Add button in the Extensions page
-
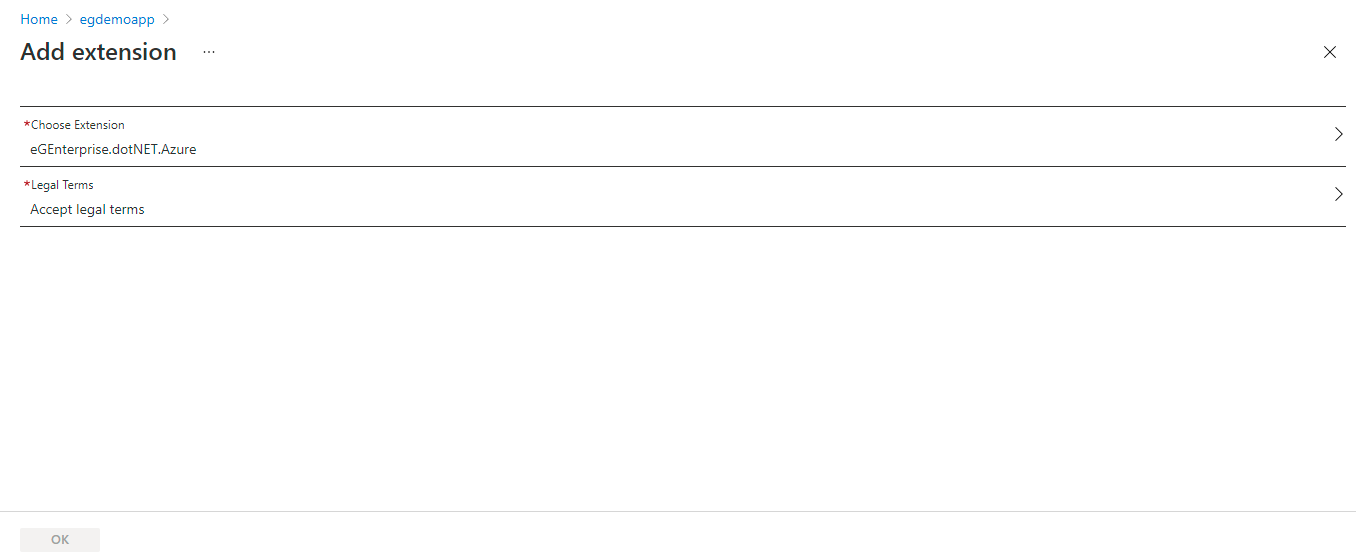
This will invoke Figure 5. From the Choose Extension drop-down list in Figure 5, select the eG extension, eGEnterprise.dotNET.Azure.
-
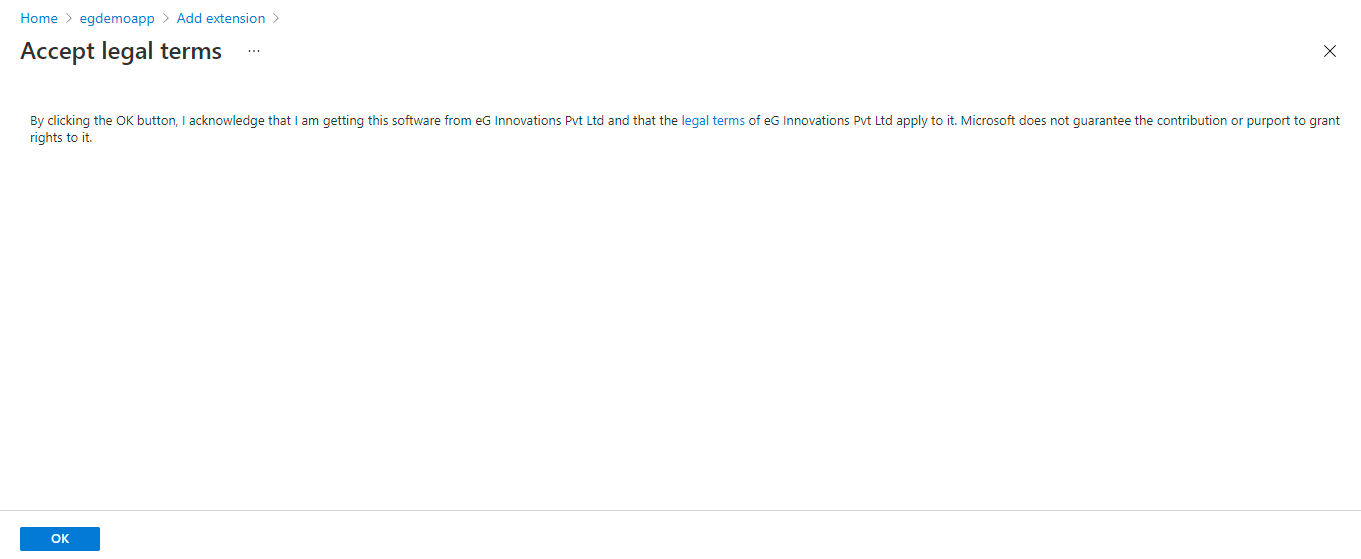
Then, click on the Accept legal terms option in the Legal Terms drop-down. Figure 6 will then appear. Click the OK button in Figure 6 to accept the legal terms.
-
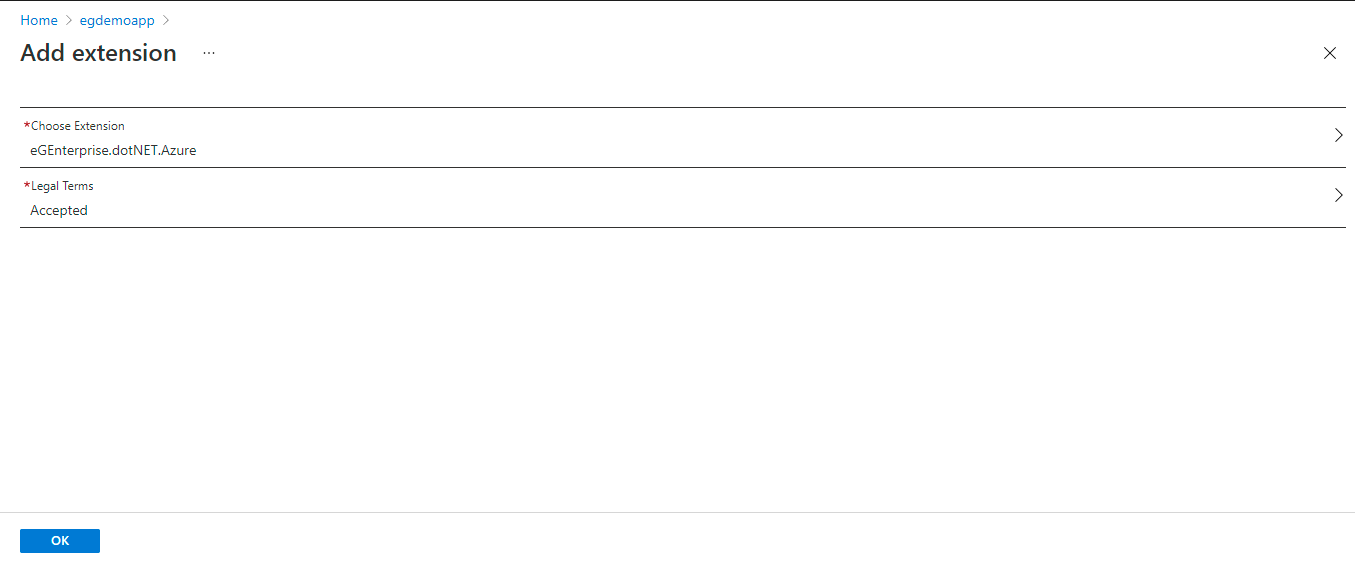
Figure 7 will then appear indicating that the Legal Terms have been Accepted. Click the OK button in Figure 7 to complete the extension creation.
-
Figure 8 will then appear displaying the eG extension that you created newly.
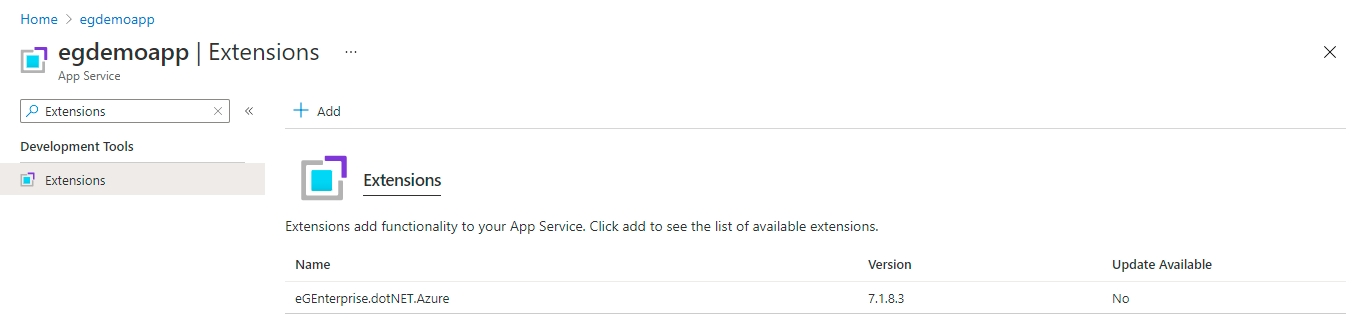
Figure 8 : The newly created eG extension displayed in the Extensions page
-
Next, restart the .NET application that is being BTM-enabled. For that, return to Figure 2 by clicking on the App Services option in Figure 1. Then, from the list of .NET applications listed in Figure 2, select the application for which the eG .NET profiler is being deployed by clicking on it. When Figure 9 appears, click on the Restart link in Figure 9 to restart that application.
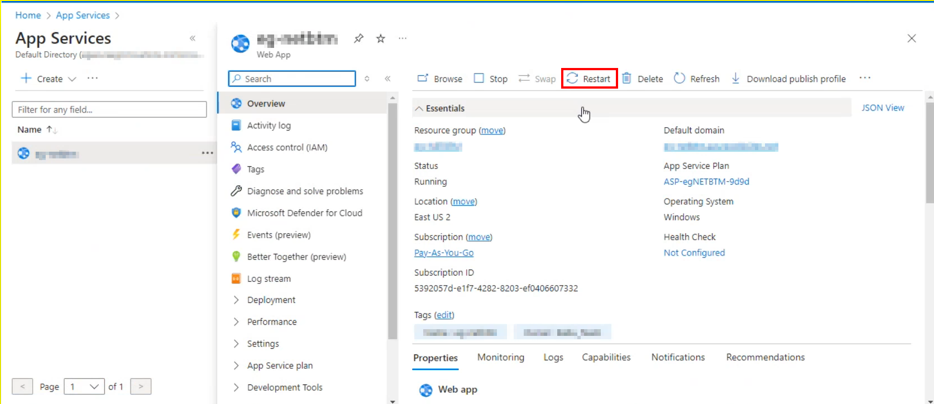
Figure 9 : Restarting the .NET Application that is being BTM-enabled
-
Next, go to the SCM web site of the .NET web application. For that, use the URL: https://<Name_of_web_application>.scm.azurewebsites.net. For instance, if the .NET web application to be monitored is egdemoapp, then the SCM URL of the app will be: https://egdemoapp.scm.azurewebsites.net.
-
Figure 10 will then appear.
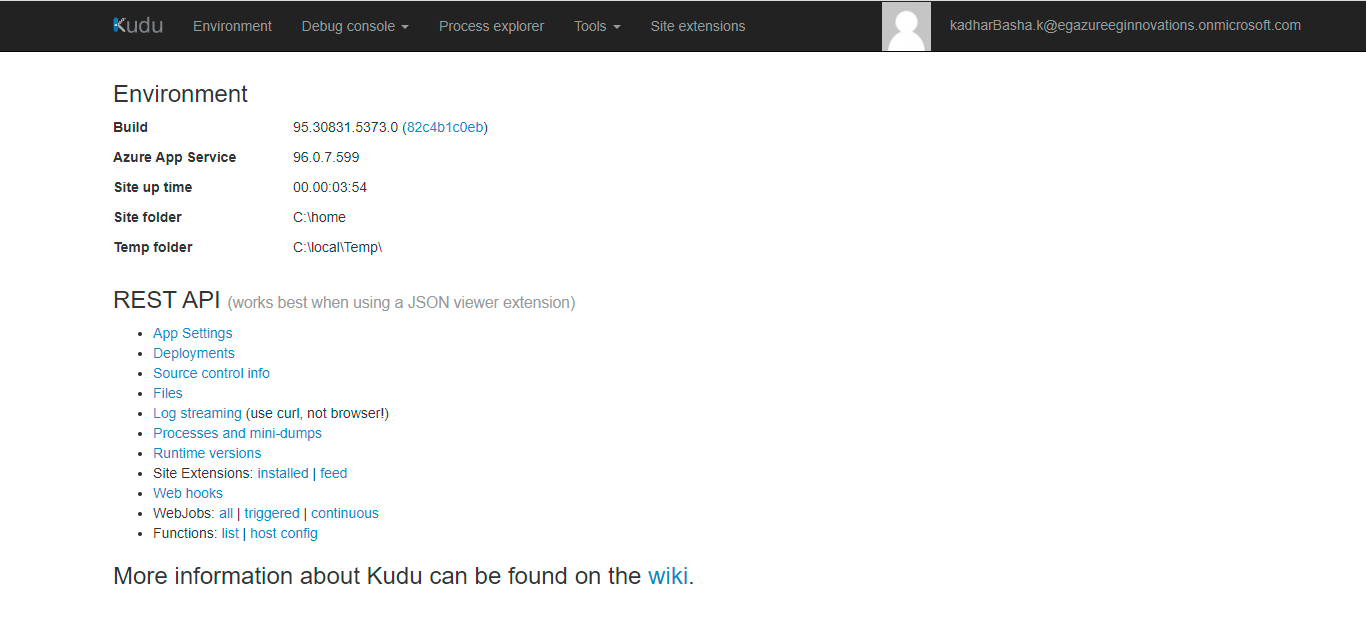
Figure 10 : The SCM web site of the target .NET web application
-
From the Debug console menu of Figure 10, select the Powershell option (see Figure 11).
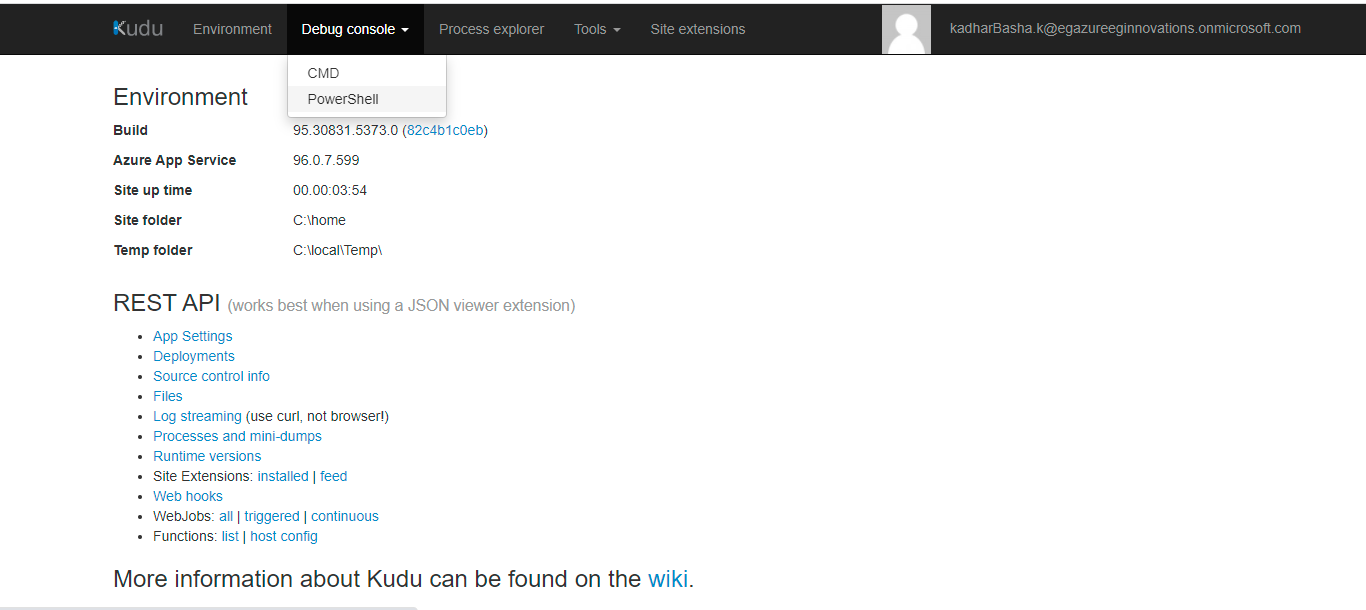
Figure 11 : Selecting the Powershell option from the Debug console menu
-
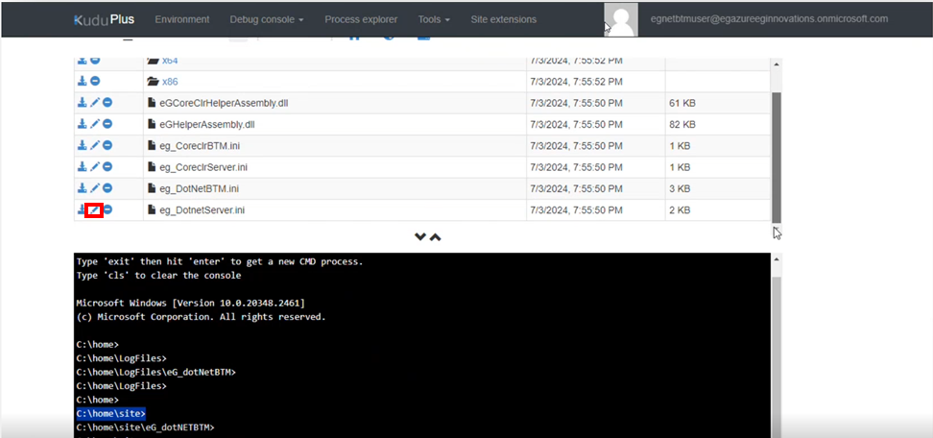
Figure 12 will then appear. In Figure 12, follow the folder sequence: site/eG_dotNETBTM. Note that once the site extension eGEnterprise.dotNET.Azure is installed, a folder named eG_dotNetBTM is created in the root of the target .NET application. If this folder is clicked, Figure 13 will appear, displaying the contents of the eG_dotNETBTM folder. Now, proceed to edit the eg_DotnetServer.ini file by clicking on the Edit icon (Pencil icon) corresponding to that file in Figure 12.
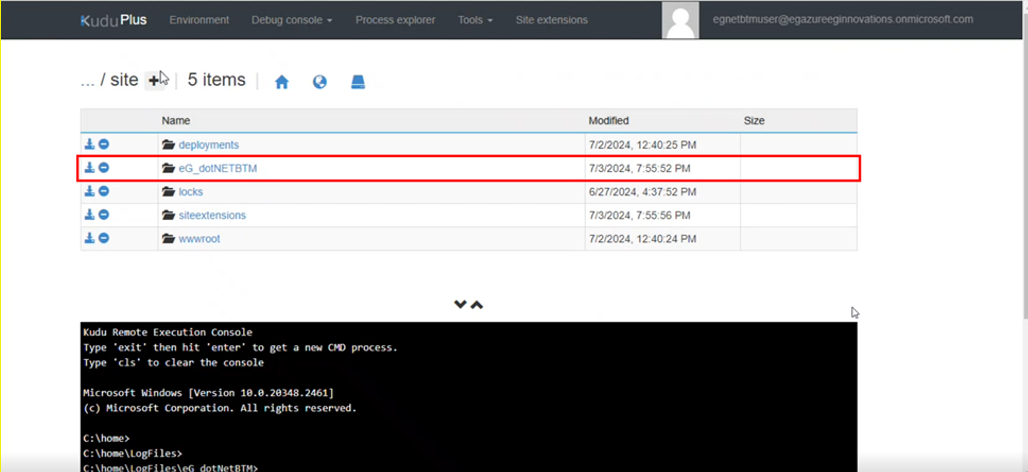
Figure 12 : Viewing the folders
-
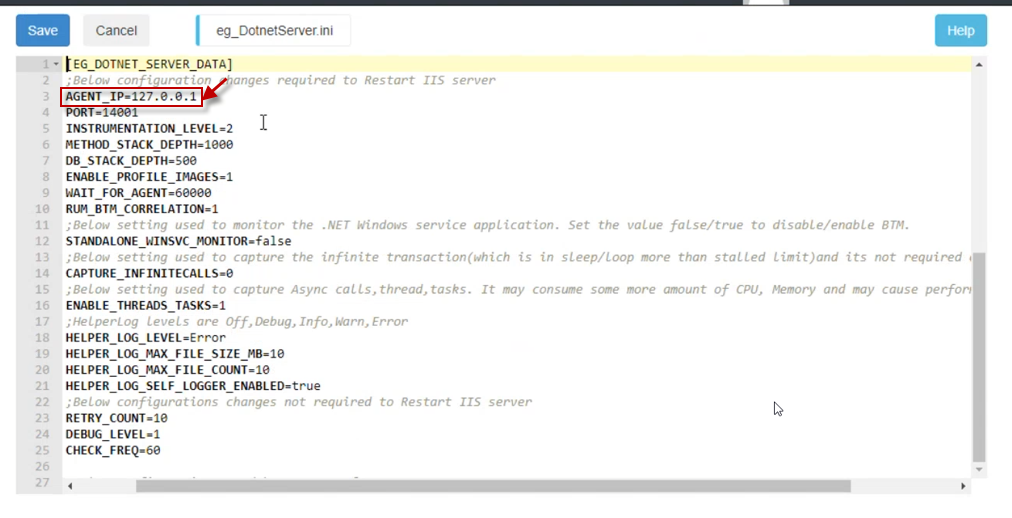
Figure 14 will then appear displaying the contents of the eg_DotnetServer.ini file. Against the Agent_IP parameter that you will see in this file, specify the IP address of the eG remote agent the profiler should communicate with. Then, save the changes by clicking the Save button in Figure 14.
-
You will then return to Figure 13. Now, copy the eGHelperAssembly.dll file in the \site\eG_dotNETBTM folder to the \site\wwwroot\bin folder. For this, at the Powershell command prompt in Figure 13, issue the following command:
Copy-Item -Path <Application_Install_Dir>\site\eG_dotNETBTM\eGHelperAssembly.dll -Destination <Application_Install_Dir>\site\wwwroot\bin
For instance, if the target .NET application is installed in the D:\home folder, then the command to copy will be:
Copy-Item -Path D:\home\site\eG_dotNETBTM\eGHelperAssembly.dll -Destination D:\home\site\wwwroot\bin
Alternatively, at the PowerShell prompt, you can first switch to the \site\wwwroot\bin, directory and then issue the following command:
cp <Application_Install_Dir>\site\eG_dotNETBTM\eGHelperAssembly.dll
For instance, f the target .NET application is installed in the C:\home folder, then, you have to issue the command indicated by Figure 15:
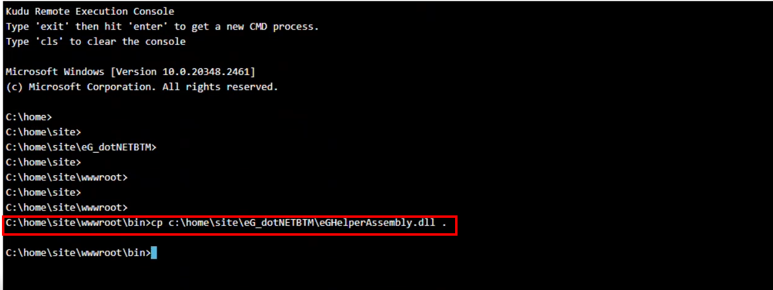
Figure 15 : Command for copying the eGHelperAssembly.dll file to the \site\wwwroot\bin directory
-
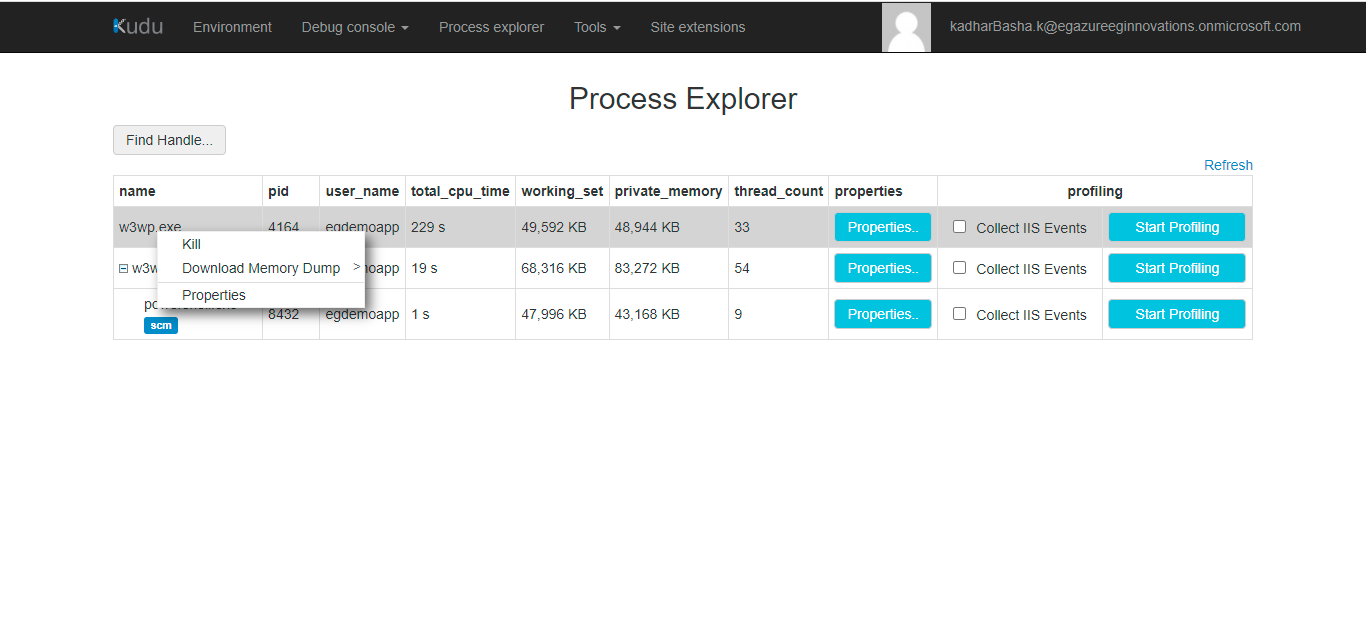
Once the file is successfully copied, click on the Process Explorer option in the main menu of the Kudu console. Figure 16 will appear. Right-click on the w3wp.exe process displayed at the top of Figure 16 and select the Kill option from the shortcut menu that appears to kill that process.
- Once the process is killed, send a request to the target .NET application.
How to Check if the eG .NET Profiler has been Successfully Deployed?
To check if the profiler has been successfully deployed, do the following:
-
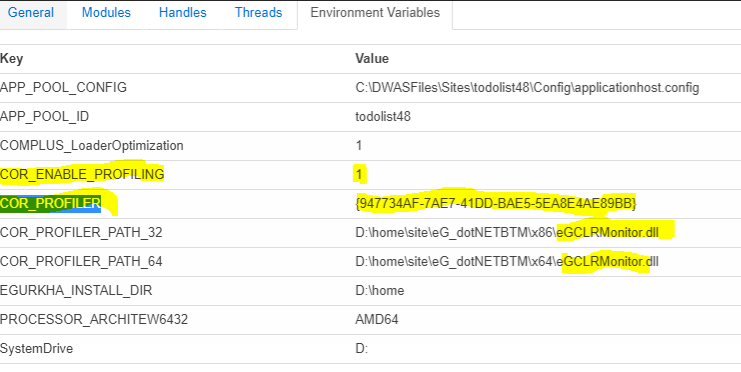
In the Process Explorer page of Figure 16, right-click on the w3wp.exe process and select the Properties option from the menu that pops out. Then, click on the Environment Variables tab page. This will invoke Figure 17.
-
In Figure 17, check if the COR_ENABLE_PROFILING variable is set to the value 1. Also, check if a GUID is displayed against COR_PROFILER. Also, see if the COR_PROFILER_PATH_32 and COR_PROFILER_PATH_64 variables display the path to the eGCLRMonitor.dll. If all the above are true, then you can conclude that the eG .NET Profiler has been installed successfully.
How Does the eG .NET Profiler Work?
Typically, transaction requests to .NET applications are handled by worker processes. Upon receipt of a request, the worker process automatically invokes an instance of the .NET CLR to process the request. At the same time, the worker process also loads an instance of the .NET profiler. Once the profiler latches on to a worker process, it injects a .NET code into the .NET application code. The injected code adds a GUID to each unique transaction to the application, and performs the following tasks:
- Traces the path of a transaction;
- Measures the responsiveness of a transaction by computing the time difference between when the transaction started and when it ended;
- Identifies the slow, stalled, and error transactions, and computes the count of such transactions;
- Discovers the exit calls made by a transaction, determines the destination of the calls, and measures the average time taken by each call to process the requests for a transaction;
The profiler then sends all these statistics to the eG agent. To know how and when the profiler transmits metrics to the eG agent, refer to How Does the .NET Profiler Communicate with the eG Agent?
Troubleshooting Issues with the eG .NET Profiler
To enable administrators to easily troubleshoot issues related to the eG .NET Profiler on Azure, eG Enterprise automatically creates four log files in the site\wwwroot\LogFiles\eG_DotNetBTM directory of the target .NET application. These log files are listed in Figure 18.
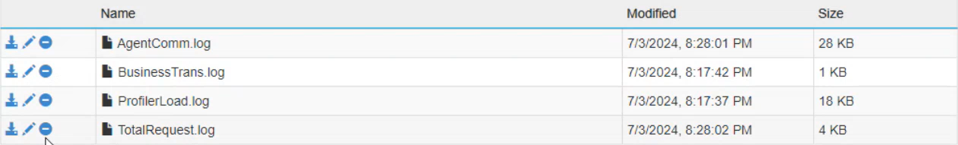
Figure 18 : Log files that help troubleshoot eG .NET Profiler-related issues