Azure Activity Logs Test
The Activity log is a platform log in Azure that provides insight into subscription-level events. This includes such information as when a resource is modified or when a virtual machine is started. Events of varying severity levels - eg., critical events, warning events, information events - and events of different categories - eg., administrative, service health, resource health etc. - are logged in the Activity log.
To promptly, and sometimes proactively, capture problem conditions, resolve bottlenecks, and avert potential disasters, administrators need to be alerted as soon as a critical/warning event, a serious health issue, or a crucial operational failure is logged in the Activity log. This is exactly what the Azure Activity Logs test does!
This test monitors the Activity log and reports the count of events logged per severity/category. In the process, the test notifies administrators every time a problem condition is captured by the log. Detailed diagnostics provide additional problem insights to administrators, thereby easing troubleshooting.
Note:
Typically, to consolidate log entries, correlate log data, and perform complex analysis, the Activity log is often sent to one/more Log Analytics Workspaces. This test reports valid metrics on events by reading data from these Log Analytics Workspaces only. If the Activity log is not sent to any Log Analytics Workspace, then this test will only report the value 0 for all its measures. To avoid this, before configuring this test, make sure that the Activity log is configured to be sent to at least one Log Analytics Workspace. Follow the steps discussed in Configuring the Activity Log to be Sent to a Log Analytics Workspace to achieve this:
Target of the Test: A Microsoft Azure Subscription
Agent deploying the test: A remote agent
Output of the test: One set of results for the configured SUBSCRIPTION ID
| Parameters | Description |
|---|---|
|
Test Period |
How often should the test be executed. |
|
Host |
The host for which the test is to be configured. |
|
Subscription ID |
This field will be automatically populated if you have chosen to automatically fulfill the pre-requisites for monitoring the Microsoft Azure Subscription. Specify the GUID which uniquely identifies the Microsoft Azure Subscription to be monitored in this text box
|
|
Tenant ID |
This field will be automatically populated if you have chosen to automatically fulfill the pre-requisites for monitoring the Microsoft Azure Subscription. Specify the Directory ID of the Azure Entra ID tenant to which the target subscription belongs in this text box |
|
Client ID, Client Password, and Confirm Password |
To connect to the target subscription, the eG agent requires an Access token in the form of an Application ID and the client secret value. For this purpose, you should register a new application with the Microsoft Entra tenant. To know how to create such an application and determine its Application ID and client secret, refer to Configuring the eG Agent to Monitor a Microsoft Azure Subscription Using Azure ARM REST API. Specify the Application ID of the created Application in the Client ID text box and the client secret value in the Client Password text box |
|
Proxy Host and Proxy Port |
In some environments, all communication with the Azure cloud could be routed through a proxy server. In such environments, you should make sure that the eG agent connects to the cloud via the proxy server and collects metrics. To enable metrics collection via a proxy, specify the IP address of the proxy server and the port at which the server listens against the Proxy Host and Proxy Port parameters. By default, these parameters are set to none, indicating that the eG agent is not configured to communicate via a proxy, by default. |
|
Proxy Username, Proxy Password and Confirm Password |
If the proxy server requires authentication, then, specify a valid proxy user name and password in the Proxy Username and Proxy Password parameters, respectively. Then, confirm the password by retyping it in the Confirm Password text box. |
|
Log Analytics Workspace Name |
Typically, the Activity log is sent to a Log Analytics Workspace to:
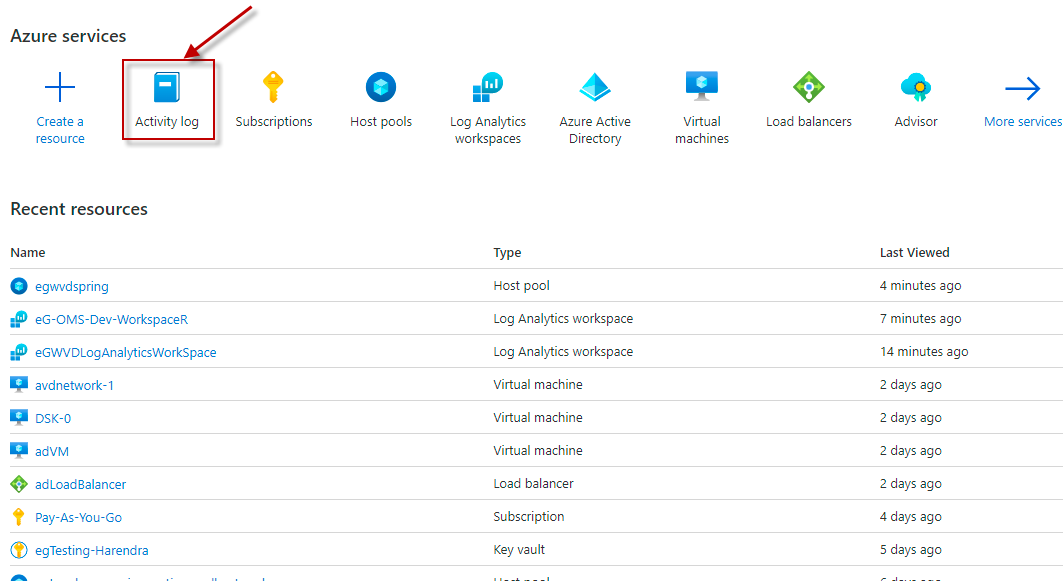
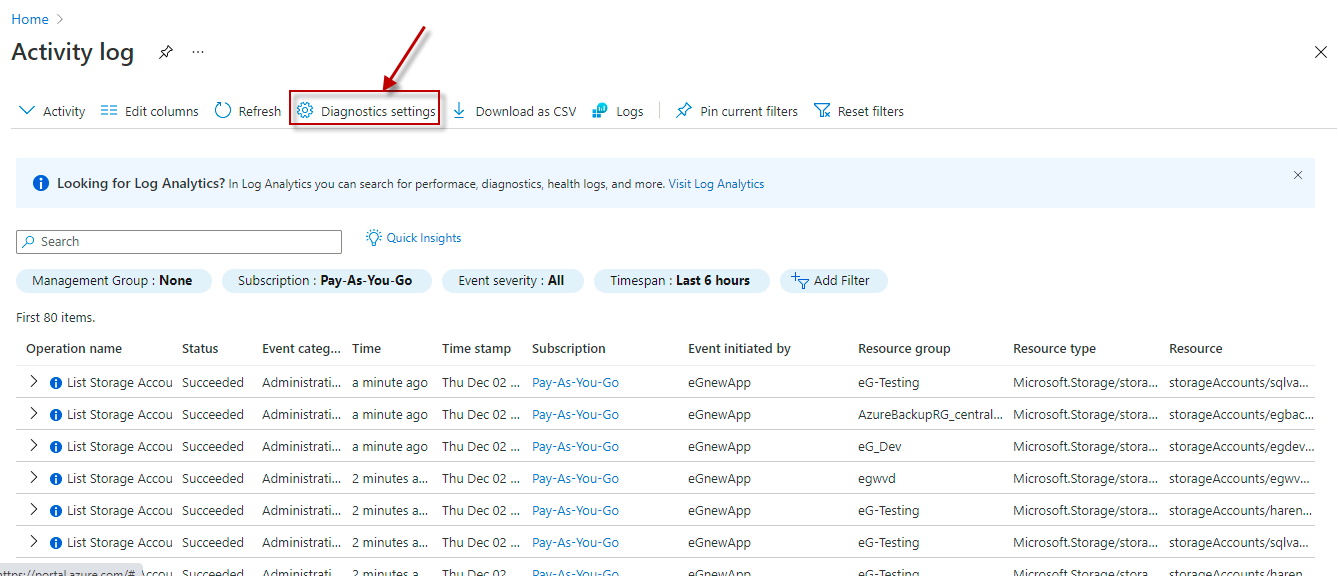
By default, the Log Analytics Workspace Name parameter is set to All. This indicates that the test reads event data from all Log Analytics Workspaces configured for the target subscription, by default. However, if you want the test to use only those Log Analytics Workspaces to which the Activity logs have been sent, then provide the names of these workspaces here as a comma-separated list. To determine the names of the workspaces, do the following: Selecting the Activity log option
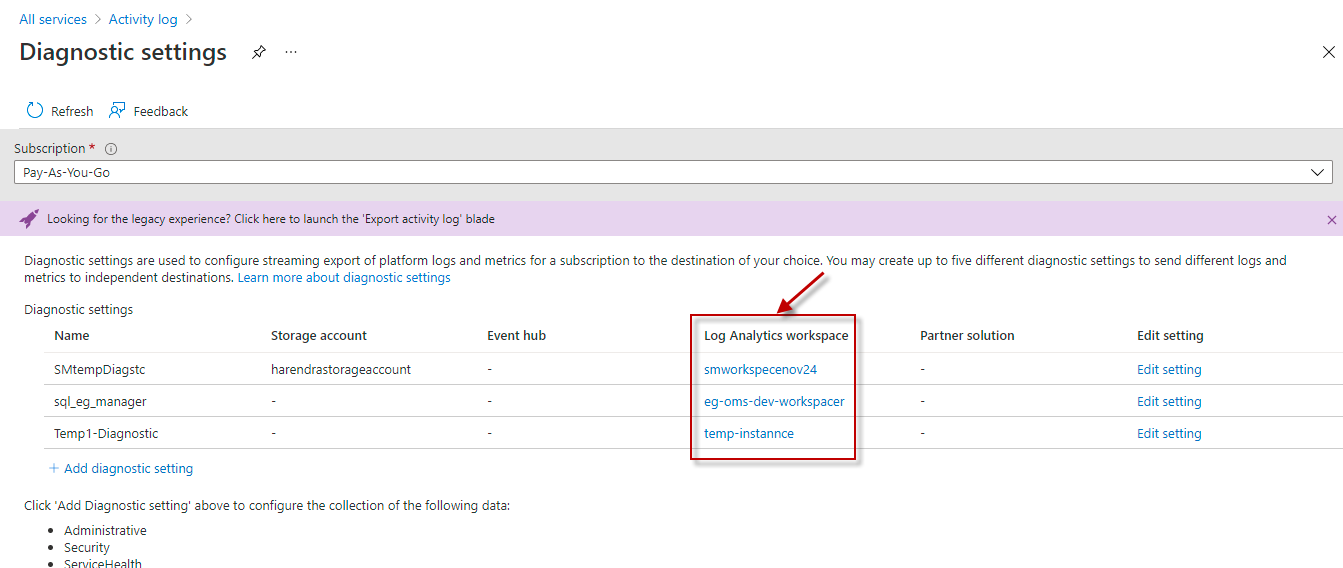
However, If the Log Analytics workspace column in is blank for all the existing diagnostic settings, it is a clear indication that the Activity log is yet to be configured to be sent to any Log Analytics Workspace. In this case therefore, you should create a new diagnostic setting for the target Subscription, where a Log Analytics Workspace is configured as the destination for the Activity log. To achieve this, follow the procedure detailed in Configuring the Activity Log to be Sent to a Log Analytics Workspace. |
|
Exclude Operations |
By default, this test does not monitor list and view operations logged in the Activity log. Accordingly, this parameter is set to *list*|*view*, by default. In a typical Azure organization, 'list' and 'view'operations are very commonplace.Numerous events related to such operations will be logged in the logs. If these operations are monitored and detailed analytics related to these operations are periodically stored in the eG database, they can grow uncontrollably over time, and may even end up choking the database. This is why, the 'list' and 'view' operations are excluded frommonitoring by default. If required, you can exclude more operations from monitoring, by appending their patterns as a grep-separated list. For instance, if you want to exclude 'restart' operations and 'health update' operations from monitoring, then your complete Exclude Operations specification will be: *list*|*view*|*restart*|*health* |
|
DD For Information |
By default, this parameter is set to false. This means that the test will not report detailed diagnostics for the Number of information events measure by default. In the real world typically, hundreds of information events will be logged in the Activity log. If the eG database in your environment is not adequately sized, then any attempt to store the details of all these information events in the database may end up choking it. The default setting of this parameter averts such disastrous consequences, while also conserving database space. On the other hand, if the eG database in your environment is well-sized and well-tuned, you can set this flag to true. In this case, the test will capture and report the details of information events as part of detailed diagnosis. |
|
DD For AVD Operations |
By default, this parameter is set to false. This means that the test will not report detailed diagnostics for the AVD Operations measure by default. In a typical AVD environment, hundreds of AVD operations will occur on a daily basis, and will be logged in the Activity log. If the eG database in your environment is not adequately sized, then any attempt to store the details of all these operations in the database may end up choking it. The default setting of this parameter averts such disastrous consequences, while also conserving database space. On the other hand, if the eG database in your environment is well-sized and well-tuned, you can set this flag to true. In this case, the test will capture and report the details of AVD operations as part of detailed diagnosis. |
|
DD Frequency |
Refers to the frequency with which detailed diagnosis measures are to be generated for this test. The default is 1:1. This indicates that, by default, detailed measures will be generated every time this test runs, and also every time the test detects a problem. You can modify this frequency, if you so desire. Also, if you intend to disable the detailed diagnosis capability for this test, you can do so by specifying none against DD frequency. |
|
Detailed Diagnosis |
To make diagnosis more efficient and accurate, the eG Enterprise embeds an optional detailed diagnostic capability. With this capability, the eG agents can be configured to run detailed, more elaborate tests as and when specific problems are detected. To enable the detailed diagnosis capability of this test for a particular server, choose the On option. To disable the capability, click on the Off option. The option to selectively enable/disable the detailed diagnosis capability will be available only if the following conditions are fulfilled:
|


| Measurement | Description | Measurement Unit | Interpretation |
|---|---|---|---|
|
Number of critical events |
Indicates the number of critical events logged in the activity log. |
Number |
Critical events are events that demand the immediate attention of a system administrator. The incidence of a critical event may indicate that an application or system has failed or stopped responding. Ideally therefore, the value of this measure should be 0. If a non-zero value is reported, then use the detailed diagnosis of this measure to view the complete details of the critical events. |
|
Number of error events |
Indicates the number of error events logged in the activity log. |
Number |
Error events are events that indicate a problem, but do not require immediate attention. Ideally therefore, the value of this measure should be 0. If a non-zero value is reported, then use the detailed diagnosis of this measure to view the complete details of the error events. |
|
Number of warning events |
Indicates the number of warning events logged in the activity log. |
Number |
Warning events are those that provide forewarning of potential problems. Such events indicate that a resource is not in an ideal state and may degrade later into showing errors or critical events. Ideally therefore, the value of this measure should be 0. If a non-zero value is reported, then use the detailed diagnosis of this measure to view the complete details of the warning events. Studying these events closely may proactively alert you to probable problem situations. |
|
Number of information events |
Indicates the number of information events logged in the activity log. |
Number |
Information events are those that pass non-critical information to the administrator - similar to a note that says: "For your information". Use the detailed diagnosis of this measure to view the complete details of information events logged in the activity log. |
|
Number of administrative events |
Indicates the number of events in the activity log that belong to the Administrative category. |
Number |
The Administrative category contains the record of all create, update, delete, and action operations performed through Resource Manager. Examples of Administrative events include create virtual machine and delete network security group. Every action taken by a user or application using Resource Manager is modeled as an operation on a particular resource type. If the operation type is Write, Delete, or Action, the records of both the start and success or fail of that operation are recorded in the Administrative category. Administrative events also include any changes to Azure role-based access control in a subscription. |
|
Number of policy events |
Indicates the number of events in the activity log that belong to the Policy category. |
Number |
The Policy category contains records of all effect action operations performed by Azure Policy. Examples of Policy events include Audit and Deny. Every action taken by Policy is modeled as an operation on a resource. |
|
Number of security events |
Indicates the number of events in the activity log that belong to the Security category. |
Number |
The Security category contains the record of alerts generated by Microsoft Defender for Cloud. An example of a Security event is Suspicious double extension file executed. Service Health events come in Six varieties: Action Required, Assisted Recovery, Incident, Maintenance, Information, or Security. These events are only created if you have a resource in the subscription that would be impacted by the event. |
|
Number of service health events |
Indicates the number of events in the activity log that belong to the Service Health category. |
Number |
The Service Health category contains the record of any service health incidents that have occurred in Azure. An example of a Service Health event SQL Azure in East US is experiencing downtime. |
|
Number of resource health events |
Indicates the number of events in the activity log that belong to the Resource Health category, |
Number |
The Resource Health category contains the record of any resource health events that has occurred to your Azure resources. An example of a Resource Health event is Virtual Machine health status changed to unavailable. Resource Health events can represent one of four health statuses: Available, Unavailable, Degraded, and Unknown. Additionally, Resource Health events can be categorized as being Platform Initiated or User Initiated. |
|
Number of alert events |
Indicates the number of events in the activity log that belong to the Alert category, |
Number |
The Alert category contains the record of activations for Azure alerts. An example of an Alert event is CPU % on myVM has been over 80 for the past 5 minutes. |
|
Number of |
Indicates the number of events in the activity log that belong to the Autoscale category, |
Number |
The Autoscale category contains the record of any events related to the operation of the autoscale engine based on any autoscale settings you have defined in your subscription. An example of an Autoscale event is Autoscale scale up action failed. |
|
Number of recommendation events |
Indicates the number of events in the activity log that belong to the Recommendation category, |
Number |
The Recommendation category Contains recommendation events from Azure Advisor. |
|
Number of resource create/write operations |
Indicates the number of resource create/write operations logged in the activity log. |
Number |
|
|
Number of failed events |
Indicates the number of events logged in the activity log that indicate operational failures. . |
Number |
Ideally, the value of this measure should be 0. |
|
Number of succeeded resource create/write operations |
Indicates the number of resource create/write operations that succeeded. |
Number |
|
|
Number of failed resource create/write operations |
Indicates the number of resource create/write operations that failed. |
Number |
Use the detailed diagnosis of this measure to know which resource create/write operations failed. |
|
Number of |
Indicates the number of autoscale up events that were logged in the Activity log. |
Number |
Scaling up and down, or vertical scaling, keeps the number of resources constant, but gives those resources more capacity in terms of memory, CPU speed, disk space and network. Vertical scaling is limited by the availability of larger hardware, which eventually reaches an upper limit. To know when resources were scaled up/down and why, use the detailed diagnosis of the Number of VM scale set autoscale up events or Number of VM scale set autoscale down events measure (as the case may be). |
|
Number of |
Indicates the number of autoscale down events that were logged in the Activity log. |
Number |
|
|
Resource delete operations |
Indicates the number of resource delete events that were logged in the Activity log. |
Number |
|
|
Succeeded resource delete operations |
Indicates the number of resource delete operations that succeeded. |
Number |
Use the detailed diagnosis of this measure to know which delete operations succeeded. |
|
Failed resource delete operations |
Indicates the number of resource delete operations that failed. |
Number |
Use the detailed diagnosis of this measure to know which delete operations failed. |
|
AVD operations |
Indicates the total number of AVD operations that were logged in the Activity log. |
Number |
This measure reports detailed diagnostics only if the DD FOR AVD OPERATIONS flag is set to Yes. Use the detailed diagnosis of this measure to know what type of operations were performed on AVD, when, and which ones failed. |
|
AVD autoscale events |
Indicates the number of AVD autoscale events that were captured by the Activity log. |
Number |
Autoscale lets you scale your session host virtual machines (VMs) in a host pool up or down to optimize deployment costs.
|
|
AVD hosts autoscale up events |
Indicates the number of events that were triggered for scaling up AVD host pools. |
Number |
Autoscale automatically turns on session hosts in a host pool if the used host pool capacity exceeds the capacity threshold. Use the detailed diagnosis of this measure to view the details of the autoscale up events. |
|
AVD hosts autoscale down events |
Indicates the number of events that were triggered for scaling down AVD host pools. |
Number |
Autoscale automatically turns off session hosts in a host pool if the used host pool capacity is below the capacity threshold. Scaling down can also occur if there are no user sessions on a session host. Use the detailed diagnosis of this measure to view the details of the autoscale down events. |
|
AVD hosts autoscale up failed events |
Indicates the number of AVD autoscale up events that failed. |
Number |
Ideally, the value of this measure should be 0. If not, then you can use the detailed diagnosis of this measure to know which events failed, and when. |
|
AVD hosts autoscale down failed events |
Indicates the number of AVD autoscale down events that failed. |
Number |
Ideally, the value of this measure should be 0. If not, then you can use the detailed diagnosis of this measure to know which events failed, and when. |
|
VM scale set autoscale up failed events |
Indicates the number of automatic scaling up events that failed in the Azure Virtual Machine Scale Set. |
Number |
An Azure Virtual Machine Scale Set can increase or decrease the number of VM instances that run your application. If your application demand increases, the load on the VM instances in your scale set increases. If this increased load is consistent, rather than just a brief demand, you can configure autoscale rules to increase the number of VM instances in the scale set - this is called scaling up. On an evening or weekend, your application demand may decrease. If this decreased load is consistent over a period of time, you can configure autoscale rules to decrease the number of VM instances in the scale set - this is called scaling down. This action reduces the cost to run your scale set as you only run the number of instances required to meet the current demand. If the criteria defined within an autoscale rule are fulfilled, then ideally, the scale set should automatically scale up or down (as the case may be). Accordingly, the value 0 is desired for both these measures. If these measures report a non-zero value, then it means the VM scale set could not be automatically scaled up/down in the event that a rule was triggered. This is a cause for concern. In this case therefore, use the detailed diagnosis of these measures to know which operations failed and when.
|
|
VM scale set autoscale down failed events |
Indicates the number of automatic scaling down events that failed in the Azure Virtual Machine Scale Set. |
Number |