Azure Batch Service Test
Use Azure Batch to run large-scale parallel and high-performance computing (HPC) batch jobs efficiently in Azure. Azure Batch creates and manages a pool of compute nodes (virtual machines), installs the applications you want to run, and schedules jobs to run on the nodes.
The following diagram shows steps in a common Batch workflow, with a client application or hosted service using Batch to run a parallel workload.
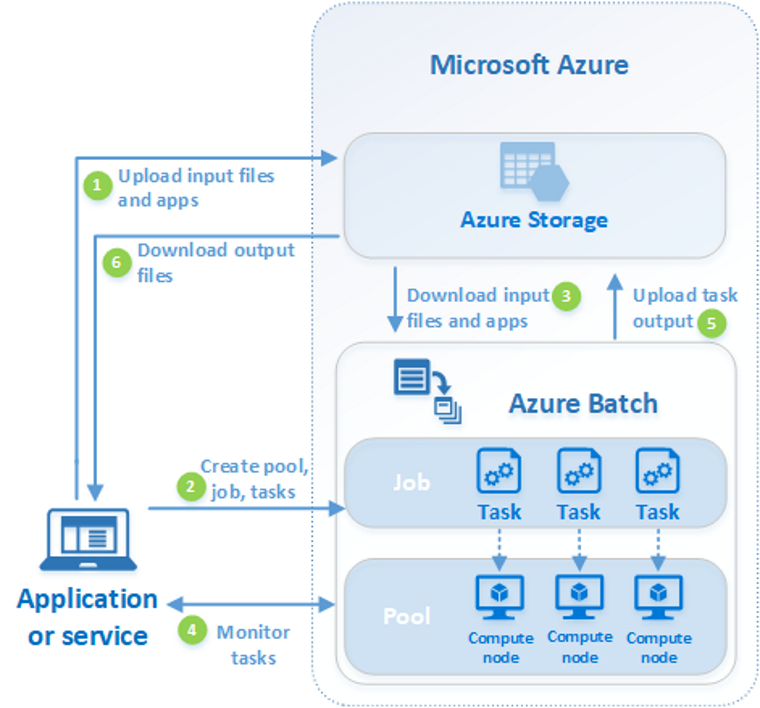
Figure 1 : A typical Batch workflow
Each of the steps illustrated in Figure 1 is discussed below:
-
Upload input files and the applications to process those files to your Azure Storage account.
-
Create a Batch pool of compute nodes (VMs) in your Batch account, a job to run the workload on the pool, and tasks in the job. .When you add tasks to a job, the Batch service automatically schedules the tasks for execution on the compute nodes in the pool.
-
Each task then downloads the input files that it needs to process, and the application that should process the files , to the assigned node. When the downloads from Azure Storage complete, the task executes on the assigned node.
-
Monitor task execution by querying Batch.
-
As tasks complete, they upload their result data to Azure Storage.
-
When your monitoring detects that the tasks in your job have completed, your client application or service can download the output data for further processing.
Because it can quickly and efficiently process large volumes of data, Azure Batch is the right platform for building SaaS applications or client apps where large-scale execution is required - eg., VFX and 3D image rendering, Media transcoding, Software testing etc. However, if when using Azure Batch for such purposes, a task fails, or one/more compute nodes become unusable and exit the pool, of if the Batch service itself encounters errors, the pace of job processing will drop. This in turn, can degrade the performance of the dependent SaaS/client apps, ultimating affecting user experience with those apps.
Also, your batch workloads are often processed according to default limits and quotas pre-defined at the subscription / batch account level. Before designing/scaling up workloads therefore, it is important for you to know the current quota definitions and whether/not they work well for you. Improperly set quotas/limits can impede batch job processing.
To ensure that Azure Batch provides robust processing services at all times, you need to constrantly track the status of the service and that of the tasks and compute nodes it manages, detect abnormalities on-the-fly, and resolve them before the UX is impacted. This is where the Azure Batch Service test helps!
This test monitors the Azure Batch Service for each resource group in the target subscription, and reports the current status of the service. Alerts are sent out if the service is in an abnormal state. The test also tracks the progress of tasks and the status of compute nodes in the pool, and notifies administrators if there are failures. By shedding light on current/potential snags in batch processing, the test prompts administrators to initiate corrective/pre-emptive action immediately, so that the dependent applications do not slow down. Additionally, the test also reports the count of compute nodes and cores in use, so you can quickly determine if the quota specifications for the same are being violated. This way, the test prompts you to increase/decrease the quotas/limits, so that they match your business workload and processing requiremements.
Target of the Test: A Microsoft Azure Subscription
Agent deploying the test: A remote agent
Output of the test: One set of results for the Batch service of each resource group in the target subscription
| Parameters | Description |
|---|---|
|
Test Period |
How often should the test be executed. |
|
Host |
The host for which the test is to be configured. |
|
Subscription ID |
This field will be automatically populated if you have chosen to automatically fulfill the pre-requisites for monitoring the Microsoft Azure Subscription. Specify the GUID which uniquely identifies the Microsoft Azure Subscription to be monitored in this text box
|
|
Tenant ID |
This field will be automatically populated if you have chosen to automatically fulfill the pre-requisites for monitoring the Microsoft Azure Subscription. Specify the Directory ID of the Azure Entra ID tenant to which the target subscription belongs in this text box |
|
Client ID, Client Password, and Confirm Password |
To connect to the target subscription, the eG agent requires an Access token in the form of an Application ID and the client secret value. For this purpose, you should register a new application with the Microsoft Entra tenant. To know how to create such an application and determine its Application ID and client secret, refer to Configuring the eG Agent to Monitor a Microsoft Azure Subscription Using Azure ARM REST API. Specify the Application ID of the created Application in the Client ID text box and the client secret value in the Client Password text box |
|
Proxy Host and Proxy Port |
In some environments, all communication with the Azure cloud be routed through a proxy server. In such environments, you should make sure that the eG agent connects to the cloud via the proxy server and collects metrics. To enable metrics collection via a proxy, specify the IP address of the proxy server and the port at which the server listens against the Proxy Host and Proxy Port parameters. By default, these parameters are set to none, indicating that the eG agent is not configured to communicate via a proxy, by default. |
|
Proxy Username, Proxy Password and Confirm Password |
If the proxy server requires authentication, then, specify a valid proxy user name and password in the Proxy Username and Proxy Password parameters, respectively. Then, confirm the password by retyping it in the Confirm Password text box. |
|
Detailed Diagnosis |
To make diagnosis more efficient and accurate, the eG Enterprise embeds an optional detailed diagnostic capability. With this capability, the eG agents can be configured to run detailed, more elaborate tests as and when specific problems are detected. To enable the detailed diagnosis capability of this test for a particular server, choose the On option. To disable the capability, click on the Off option. The option to selectively enable/disable the detailed diagnosis capability will be available only if the following conditions are fulfilled:
|


| Measurement | Description | Measurement Unit | Interpretation | ||||||||
|---|---|---|---|---|---|---|---|---|---|---|---|
|
Status |
Indicates the current status of this batch service. |
|
The values reported by this measure and its numeric equivalents are mentioned in the table below:
Note: By default, this measure reports the Measure Values listed in the table above to indicate the current status of the batch service. In the graph of this measure however, the same is represented using the numeric equivalents only. Use the detailed diagnosis of this measure to know all about the batch service. The details displayed as part of detailed diagnostics include the pool allocation mode (batch service or user subscription mode), and the quota settings. |
||||||||
|
Total core |
Indicates the total number of cores used by this batch service. |
Number |
|
||||||||
|
Total node |
Indicates the total number of compute nodes used by this batch service. |
Number |
|
||||||||
|
Low priority core |
Indicates the number of low priority cores used by this batch service. |
Number |
Use the detailed diagnosis of the Status measure to know the maximum number of low priority core (Low priority core quota) that the batch service can use. Track changes to the value of this measure if usage is well within the defined quota. If you feel the need for more low-priority cores, then request for Azure Support for an increase in the limit. |
||||||||
|
Total low priority node |
Indicates the number of low priority nodes used by this batch service. |
Number |
Azure Batch offers low-priority virtual compute nodes (VMs) to reduce the cost of Batch workloads. Low-priority VMs make new types of Batch workloads possible by enabling a large amount of compute power to be used for a very low cost. Low-priority VMs take advantage of surplus capacity in Azure. When you specify low-priority VMs in your pools, Azure Batch can use this surplus, when available. The tradeoff for using low-priority VMs is that those VMs may not always be available to be allocated, or may be preempted at any time, depending on available capacity. For this reason, low-priority VMs are most suitable for batch and asynchronous processing workloads where the job completion time is flexible and the work is distributed across many VMs. |
||||||||
|
Creating node |
Indicates the number of compute nodes in the pools managed by this batch service that are in the Creating status currently. |
Number |
Nodes that are in the Creating state are Azure-allocated VMs that have not yet started to join a pool. |
||||||||
|
Starting node |
Indicates the number of compute nodes in the pools managed by this batch service that are in the Starting state currently. |
Number |
A node on which the Batch service is starting is said to be in the Starting state. |
||||||||
|
Waiting for start task node |
Indicates the number of compute nodes in the pools managed by this batch service that are in the WaitingForStartTask state currently. |
Number |
A node is said to be in the WaitingForStartTask state if the start task has started running on that node, but waitForSuccess is set and the start task has not completed. |
||||||||
|
Start task failed node |
Indicates the number of compute nodes in the pools managed by this batch service that are in the StartTaskFailed state currently. |
Number |
A node is said to be in the StartTaskFailed state if start task failed on that node and exhausted all retries, and on which waitForSuccess is set on the start task Such a node is not usable for running tasks. Ideally therefore, the value of this measure should be 0. |
||||||||
|
Idle node |
Indicates the number of compute nodes in the pools managed by this batch service that are in the Idle state currently. |
Number |
An available compute node that is not currently running a task is said to be om an Idle state. |
||||||||
|
Offline node |
Indicates the number of compute nodes in the pools managed by this batch service that are in the Offline state currently. |
Number |
An offline node is one that Batch cannot use to schedule new tasks. |
||||||||
|
Rebooting node |
Indicates the number of compute nodes in the pools managed by this batch service that are in the Rebooting state currently. |
Number |
A node that is restarting is a Rebooting node. |
||||||||
|
Reimaging node |
Indicates the number of compute nodes in the pools managed by this batch service that are in the Reimaging state currently. |
Number |
A Reimaging node is one on which the operating system is being reinstalled. |
||||||||
|
Running node |
Indicates the number of compute nodes in the pools managed by this batch service that are in the Running state currently. |
Number |
A Running node is one that is running one or more tasks (other than the start task). |
||||||||
|
Leaving pool node |
Indicates the number of compute nodes in the pools managed by this batch service that are in the LeavingPool state currently. |
Number |
A node assumes the LeavingPool state if it is leaving the pool, either because the user explicitly removed it or because the pool is resizing or autoscaling down. |
||||||||
|
Unusable node |
Indicates the number of compute nodes in the pools managed by this batch service that are in the Unusable state currently. |
Number |
A node that cannot be used for task execution because of errors switches to the Unusable state. Ideally therefore, the value of this measure should be 0. |
||||||||
|
Preempted node |
Indicates the number of compute nodes in the pools managed by this batch service that are in the Preempted state currently. |
Number |
A Preempted node is a low-priority node that was removed from the pool because Azure reclaimed the VM. A preempted node can be reinitialized when replacement low-priority VM capacity is available. |
||||||||
|
Task start event |
Indicates the number of 'task start events' that were emitted by this batch service. |
Number |
A 'Task start' event is emitted once a task has been scheduled to start on a compute node by the scheduler. Note that if the task is retried or requeued this event will be emitted again for the same task, but the retry count and system task version will be updated accordingly. |
||||||||
|
Task complete event |
Indicates the number of 'task complete events' that were emitted by this batch service. |
Number |
A 'Task complete' event is emitted once a task is completed, regardless of the exit code. This event can be used to determine the duration of a task, where the task ran, and whether it was retried. |
||||||||
|
Task fail event |
Indicates the number of 'task fail events' that were emitted by this batch service. |
Number |
The 'Task fail' event is emitted when a task completes with a failure. Currently all nonzero exit codes are considered failures. This event will be emitted in addition to a task complete event and can be used to detect when a task has failed. Ideally therefore, the value of this measure should be 0. |
||||||||
|
Pool create event |
Indicates the number of 'pool create events' that were emitted by this batch service. |
Number |
The 'Pool create' event is emitted once a pool has been created. |
||||||||
|
Pool resize start event |
Indicates the number of 'pool resize events' that were emitted by this batch service. |
Number |
The 'Pool resize start' event is emitted when a pool resize has started. Such an event is typically triggered if the target size of the pool is greater than 0 compute nodes. |
||||||||
|
Pool resize complete event |
Indicates the number of 'pool resize complete events' that were emitted by this batch service. |
Number |
The 'Pool resize complete' event is emitted when a pool resize has completed or failed. |
||||||||
|
Pool delete start event |
Indicates the number of 'pool delete start events' that were emitted by this batch service. |
Number |
The 'Pool delete start' event is emitted when a pool delete operation has started. |
||||||||
|
Pool delete complete event |
Indicates the number of 'pool delete complete events' that were emitted by this batch service. |
Number |
The 'Pool delete complete' event is emitted when a pool delete operation has completed. |