Azure Billing Details - Current Month Test
At the end of each month, an Azure cloud consumer will want to determine the total cost of their cloud usage, closely analyze that month's cloud spend, and figure out which resources, resource groups, or services they spent the most on. For this, the Azure Billing Details - Current Month test can be used.
This test reveals how much the monitored subscription has been billed for in the current month. Detailed diagnosis provides the meter-wise break-up of the bill cost, along with the usage quantity. Meters are used to track a resource's usage throughout its lifetime. When you create a single Azure resource, like a virtual machine, it has one or more meter instances created. Meter-level insights lead you to the exact meter instances that contributed to the abnormal cloud spend (if any).
Additionally, the test also reports the total count of resources, resource groups, services, tags, and regions used by the target subscription. Detailed diagnostics reveal the exact names of the entities (i.e, resources, resource groups, services etc.) consumed and the pre-tax cost per entity. If a subscription's usage is abnormally high in any month, then this entity-level visibility will pinpoint which specific entities contributed to it.
Note:
The previous month's bill will be fetched till the second day of the consecutive month. From the third day of the consecutive month, bill gets generated for the current month based on the date given as input for fetching the bill.
Target of the Test: A Microsoft Azure Subscription
Agent deploying the test: A remote agent
Output of the test: One set of results for the target Azure subscription
| Parameters | Description |
|---|---|
|
Test Period |
How often should the test be executed. |
|
Host |
The host for which the test is to be configured. |
|
Subscription ID |
This field will be automatically populated if you have chosen to automatically fulfill the pre-requisites for monitoring the Microsoft Azure Subscription. Specify the GUID which uniquely identifies the Microsoft Azure Subscription to be monitored in this text box
|
|
Tenant ID |
This field will be automatically populated if you have chosen to automatically fulfill the pre-requisites for monitoring the Microsoft Azure Subscription. Specify the Directory ID of the Azure Entra ID tenant to which the target subscription belongs in this text box |
|
Client ID, Client Password, and Confirm Password |
To connect to the target subscription, the eG agent requires an Access token in the form of an Application ID and the client secret value. For this purpose, you should register a new application with the Microsoft Entra tenant. To know how to create such an application and determine its Application ID and client secret, refer to Configuring the eG Agent to Monitor a Microsoft Azure Subscription Using Azure ARM REST API. Specify the Application ID of the created Application in the Client ID text box and the client secret value in the Client Password text box |
|
Proxy Host and Proxy Port |
In some environments, all communication with the Azure cloud be routed through a proxy server. In such environments, you should make sure that the eG agent connects to the cloud via the proxy server and collects metrics. To enable metrics collection via a proxy, specify the IP address of the proxy server and the port at which the server listens against the Proxy Host and Proxy Port parameters. By default, these parameters are set to none, indicating that the eG agent is not configured to communicate via a proxy, by default. |
|
Proxy Username, Proxy Password and Confirm Password |
If the proxy server requires authentication, then, specify a valid proxy user name and password in the Proxy Username and Proxy Password parameters, respectively. Then, confirm the password by retyping it in the Confirm Password text box. |
|
DD Frequency |
Refers to the frequency with which detailed diagnosis measures are to be generated for this test. The default is 1:1. This indicates that, by default, detailed measures will be generated every time this test runs, and also every time the test detects a problem. You can modify this frequency, if you so desire. Also, if you intend to disable the detailed diagnosis capability for this test, you can do so by specifying none against DD frequency. |
|
Detailed Diagnosis |
To make diagnosis more efficient and accurate, the eG Enterprise embeds an optional detailed diagnostic capability. With this capability, the eG agents can be configured to run detailed, more elaborate tests as and when specific problems are detected. To enable the detailed diagnosis capability of this test for a particular server, choose the On option. To disable the capability, click on the Off option. The option to selectively enable/disable the detailed diagnosis capability will be available only if the following conditions are fulfilled:
|


| Measurement | Description | Measurement Unit | Interpretation | ||||||
|---|---|---|---|---|---|---|---|---|---|
|
Total billing cost |
Indicates the total value (in USD) for which this subscription was billed for its current month's usage. |
USD |
If the value of this measure is abnormally high, then use the detailed diagnosis of this measure to view the meter-wise break-up of the cost and usage quantity. This will point you to those meters that were utilized excessively during the current month, thus contributing to the high cloud spend. |
||||||
|
Total used resource groups |
Indicates the total number of resource groups used by the target subscription. |
Number |
Azure Resources Groups are logical collections of virtual machines, storage accounts, virtual networks, web apps, databases, and/or database servers. Typically, users will group related resources for an application, divided into groups for production and non-production — but you can subdivide further as needed. Use the detailed diagnosis of this measure to know which resource groups were used, and the (pre-tax) cost of usage of each resource group. In the event of any abnormal cloud spend, the detailed metrics will point you to those resource groups that may have increased the current month's cloud usage cost. |
||||||
|
Total used resources |
Indicates the total number of resources used by the target subscription during the current month. |
Number |
A resource is a manageable item that is available through Azure. Virtual machines, storage accounts, web apps, databases, and virtual networks are examples of resources. Use the detailed diagnosis of this measure to know which resources were used, and the (pre-tax) cost of usage of each resource. In the event of any abnormal cloud spend, the detailed metrics will point you to those resources that may have increased the current month's cloud usage cost. |
||||||
|
Total used services |
Indicates the total number of services used by the target subscription during the current month. |
Number |
Use the detailed diagnosis of this measure to know which services were used, and the (pre-tax) cost of usage of each service. In the event of any abnormal cloud spend, the detailed metrics will point you to those services that may have increased the current month's cloud usage cost. |
||||||
|
Total used tags |
Indicates the total number of tags used by the target subscription during the current month. |
Number |
Tags are name and value pairs that enable you to categorize resources and view consolidated billing. You can apply the same tag to multiple resources and resource groups. Use the detailed diagnosis of this measure to know which tags were used, and the (pre-tax) cost of usage of each tag. In the event of any abnormal cloud spend, the detailed metrics will point you to those tags that may have increased the current month's cloud usage cost. |
||||||
|
Total used regions |
Indicates the total number of regions used by the target subscription during the current month. |
Number |
Use the detailed diagnosis of this measure to know which regions were used, and the (pre-tax) cost of usage of each region. In the event of any abnormal cloud spend, the detailed metrics will point you to those regions that may have increased the current month's cloud usage cost. |
||||||
|
Current month period |
Indicates whether/not the billing period of the target subscription falls in the current month. |
|
The values that this measure can report and their corresponding numeric values are as follows:
Note: By default, this measure reports the Measure Values listed in the table above to indicate whether/not a subscription's billing period falls within the current month. In the graph of this measure however, the same is represented using the numeric equivalents only. Use the detailed diagnosis of this measure to know what the billing period of the subscription is. |
||||||
|
Billing profile count |
Indicates the number of billing profiles that are available for this subscription. |
Number |
A billing profile is automatically created along with your billing account when you sign up for Azure. You may create additional billing profiles to organize your costs in multiple monthly invoices. Use the detailed diagnosis of this measure to view the list of profiles associated with the target subscription. |
||||||
|
Cloud cost during the last measure period |
Indicates the cost for this subscription since the last time this test ran. |
USD |
|
Use the detailed diagnosis of the Total billing cost measure to view the meter-wise break-up of the cost and usage quantity. This will point you to those meters that were utilized excessively during the current month, thus contributing to the high cloud spend.
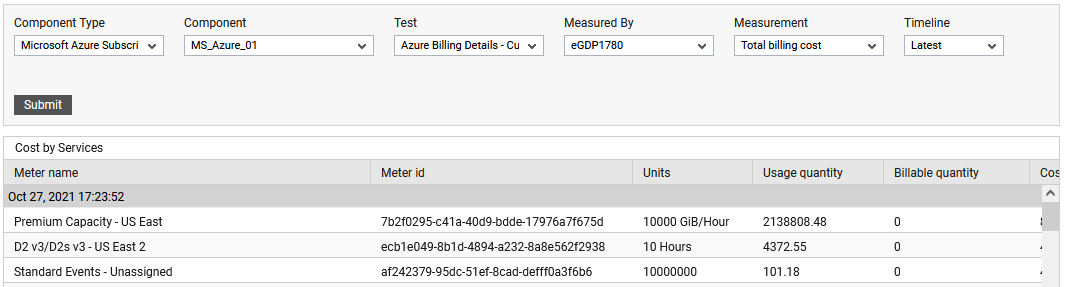
Figure 3 : The detailed diagnosis of the Total billing cost measure
Use the detailed diagnosis of the Total used resource groups measure to know which resource groups were used, and the (pre-tax) cost of usage of each resource group. In the event of any abnormal cloud spend, the detailed metrics will point you to those resource groups that may have increased the current month's cloud usage cost.
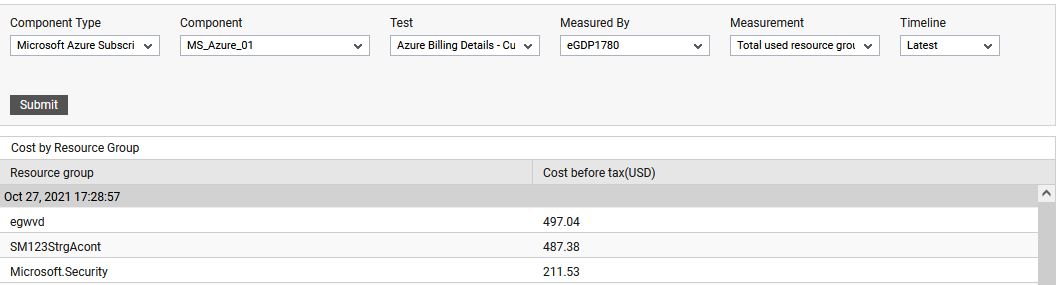
Figure 4 : The detailed diagnosis of the Total used resource groups measure
Use the detailed diagnosis of the Total used resources measure to know which resources were used, and the (pre-tax) cost of usage of each resource. In the event of any abnormal cloud spend, the detailed metrics will point you to those resources that may have increased the current month's cloud usage cost.
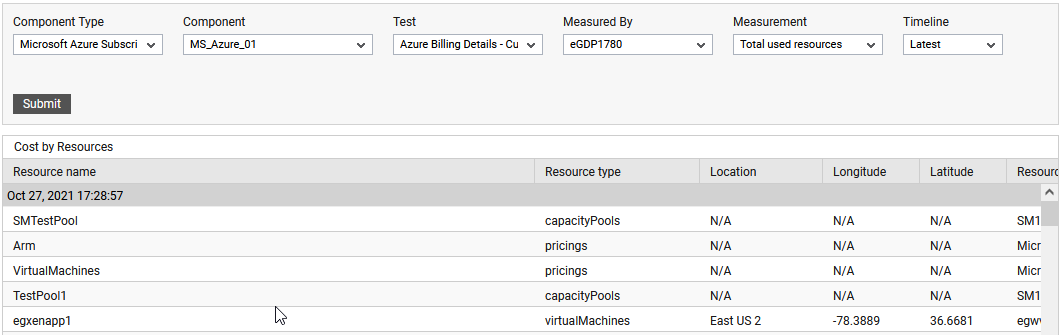
Figure 5 : The detailed diagnosis of the Total used resources measure
Use the detailed diagnosis of the Total used services measure to know which services were used, and the (pre-tax) cost of usage of each service. In the event of any abnormal cloud spend, the detailed metrics will point you to those services that may have increased the current month's cloud usage cost.
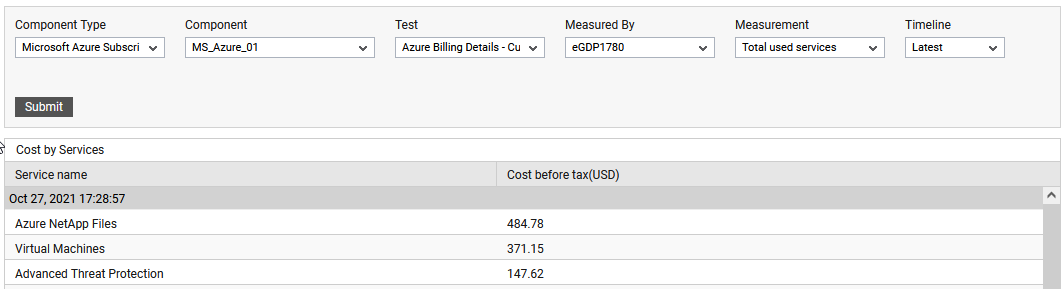
Figure 6 : The detailed diagnosis of the Total used services measure
Use the detailed diagnosis of the Total used tags measure to know which tags were used, and the (pre-tax) cost of usage of each tag. In the event of any abnormal cloud spend, the detailed metrics will point you to those tags that may have increased the current month's cloud usage cost.
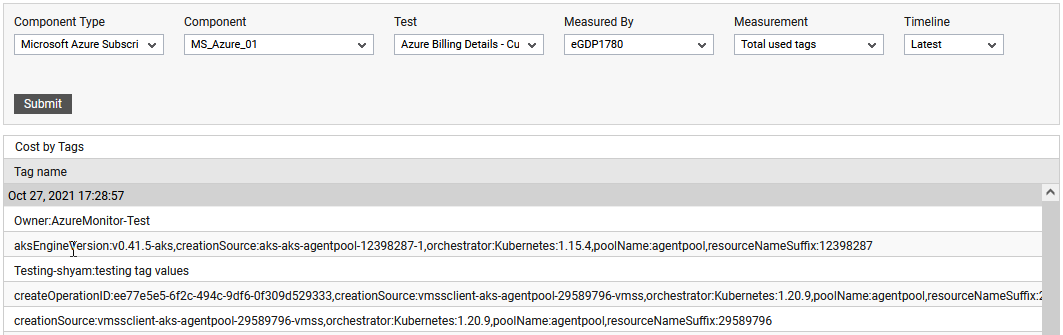
Figure 7 : The detailed diagnosis of the Total used tags measure
Use the detailed diagnosis of the Total used regions measure to know which regions were used, and the (pre-tax) cost of usage of each region. In the event of any abnormal cloud spend, the detailed metrics will point you to those regions that may have increased the current month's cloud usage cost.
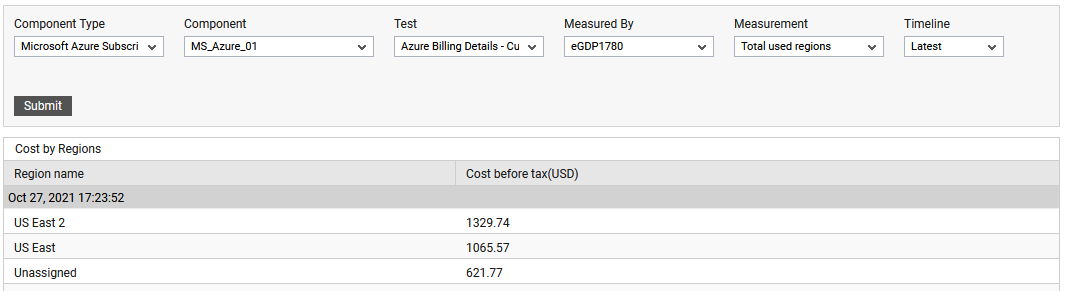
Figure 8 : The detailed diagnosis of the Total used regions measure
Use the detailed diagnosis of the Current month period measure to know what the billing period of the subscription is.
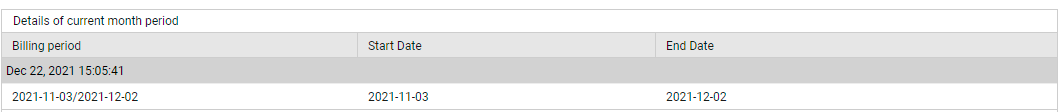
Figure 9 : The detailed diagnosis of the Current month period measure