Azure Database Server Details Test
An Azure SQL database is a managed database in Microsoft Azure that is created within an Azure resource group with a defined set of compute and storage resources for different workloads. An Azure SQL database is associated with an Azure SQL Database logical server, which is created within a specific Azure region. A logical server acts as a central administrative point for multiple databases, including SQL elastic pools logins, firewall rules, auditing rules, threat detection policies, and failover groups. A logical server can be in a different region than its resource group. The logical server must exist before you can create the Azure SQL database. All databases on a server are created within the same region as the logical server.
A logical server is a parent resource for databases, elastic pools, and data warehouses. It also provides the scope for database quota and DTU quota for the resources it contains (such as 45,000 DTU) and therefore is a high-order element of the identity of databases, elastic pools, and data warehouses for Azure resource management purposes. If the Azure logical server is not ready, then the Azure databases associated with the logical server and the resource group may not be accessible causing inconvenience to the users accessing the resources from such resource groups. Therefore, it is necessary to periodically monitor the state of the Azure logical server. The Azure Database Server Details test helps you in this regard!
For each Azure SQL Database logical server being monitored, this test reports the current state of the server and the number of Azure SQL databases associated with the logical server. In addition, this test reports the number of Database Transaction Units allocated to the SQL databases associated with the logical server and the maximum number of DTUs that can be allocated to the SQL databases.
Target of the Test: A Microsoft Azure Subscription
Agent deploying the test: A remote agent
Output of the test: One set of results for each Resource Group: Azure SQL Database logical server of the target Microsoft Azure subscription being monitored
Descriptor: Azure SQL Database logical server
| Parameters | Description |
|---|---|
|
Test Period |
How often should the test be executed. |
|
Host |
The host for which the test is to be configured. |
|
Subscription ID |
This field will be automatically populated if you have chosen to automatically fulfill the pre-requisites for monitoring the Microsoft Azure Subscription. Specify the GUID which uniquely identifies the Microsoft Azure Subscription to be monitored in this text box
|
|
Tenant ID |
This field will be automatically populated if you have chosen to automatically fulfill the pre-requisites for monitoring the Microsoft Azure Subscription. Specify the Directory ID of the Azure Entra ID tenant to which the target subscription belongs in this text box |
|
Client ID, Client Password, and Confirm Password |
To connect to the target subscription, the eG agent requires an Access token in the form of an Application ID and the client secret value. For this purpose, you should register a new application with the Microsoft Entra tenant. To know how to create such an application and determine its Application ID and client secret, refer to Configuring the eG Agent to Monitor a Microsoft Azure Subscription Using Azure ARM REST API. Specify the Application ID of the created Application in the Client ID text box and the client secret value in the Client Password text box |
|
Proxy Host and Proxy Port |
In some environments, all communication with the Azure cloud be routed through a proxy server. In such environments, you should make sure that the eG agent connects to the cloud via the proxy server and collects metrics. To enable metrics collection via a proxy, specify the IP address of the proxy server and the port at which the server listens against the Proxy Host and Proxy Port parameters. By default, these parameters are set to none, indicating that the eG agent is not configured to communicate via a proxy, by default. |
|
Proxy Username, Proxy Password and Confirm Password |
If the proxy server requires authentication, then, specify a valid proxy user name and password in the Proxy Username and Proxy Password parameters, respectively. Then, confirm the password by retyping it in the Confirm Password text box. |
|
Detailed Diagnosis |
To make diagnosis more efficient and accurate, the eG Enterprise embeds an optional detailed diagnostic capability. With this capability, the eG agents can be configured to run detailed, more elaborate tests as and when specific problems are detected. To enable the detailed diagnosis capability of this test for a particular server, choose the On option. To disable the capability, click on the Off option. The option to selectively enable/disable the detailed diagnosis capability will be available only if the following conditions are fulfilled:
|


| Measurement | Description | Measurement Unit | Interpretation | ||||||
|---|---|---|---|---|---|---|---|---|---|
|
State |
Indicates the current status of this Azure SQL Database logical server. |
|
The values reported by this measure and its numeric equivalents are mentioned in the table below:
Note: By default, this measure reports the Measure Values listed in the table above to indicate the current status of this database instance. The graph of this measure however, represents the status of a server using the numeric equivalents only - 0 or 1. The detailed diagnosis of this measure if enabled, lists the location of the database instance, the version of the SQL installed and the Fully Qualified Domain Name of the server. |
||||||
|
Number of databases |
Indicates the number of databases instances associated with this Azure SQL Database logical server. |
Number |
The detailed diagnosis of this measure lists the name of the database instances created on the database server. |
||||||
|
Current DTUs |
Indicates the number of Database Transaction Units allocated to the database instances associated with this Azure SQL Database logical server. |
Number |
For a single Azure SQL database at a specific performance level within a service tier, Microsoft guarantees a certain level of resources for that database (independent of any other database in the Azure cloud) and providing a predictable level of performance. This amount of resources is calculated as a number of Database Transaction Units or DTUs, and is a blended measure of CPU, memory, I/O (data and transaction log I/O). |
||||||
|
Maximum DTUs |
Indicates the maximum number of Database Transactions Units that can be allocated to the database instances associated with this Azure SQL Database logical server. |
Number |
|
The detailed diagnosis of the State measure if enabled, lists the location of the database instance, the version of the SQL installed and the Fully Qualified Domain Name of the server.
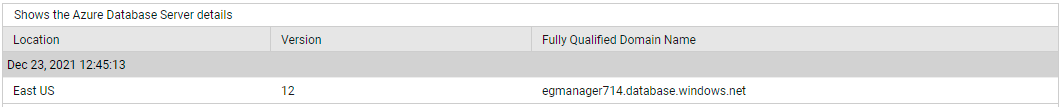
Figure 3 : The detailed diagnosis of the State measure reported by the Azure Database Server Details test
The detailed diagnosis of the Number of databases measure lists the name of the database instances created on the database server.
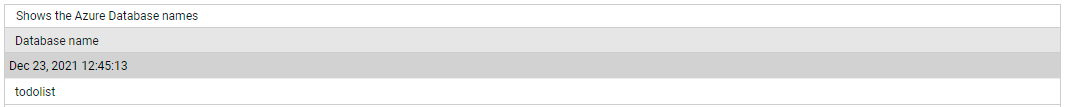
Figure 4 : The detailed diagnosis of the Number of databases measure