
Azure Virtual Machines Test
Azure Virtual Machines is one of several types of on-demand, scalable computing resources that Azure offers. An Azure virtual machine gives you the flexibility of virtualization without having to buy and maintain the physical hardware that runs the virtual machine.
Azure Virtual Machines lets you create and use virtual machines in the cloud. Providing what's known as Infrastructure as a Service (IaaS), virtual machine technology can be used in variety of ways. Some examples are:
Virtual machines (VMs) for development and test. Development groups commonly use VMs because they offer a quick, easy way to create a computer with specific configurations required to code and test an application. Azure Virtual Machines provides a straightforward and economical way to create these VMs, use them, then delete them when they're no longer needed.
Running applications in the cloud. It makes economic sense to run some applications in the public cloud. One example is an application that has large spikes in demand. Although you could equip your own data center with enough hardware to handle peak demand, that hardware might be underutilized much of the time. Running this application on Azure lets you pay for extra VMs only when you need them and shut them down when you don't. Or, suppose you're a start-up that needs on-demand computing resources quickly and with no commitment. Once again, Azure can be the right choice.
Extending your own datacenter into the public cloud. When you use Azure Virtual Network, your organization can create a virtual network (VNET) that's an extension of your own on-premises network and add VMs to that VNET. This allows running applications such as SharePoint, SQL Server and others on an Azure VM. This approach might be easier to deploy or less expensive than running them in VMs your own datacenter.
Disaster recovery. Rather than paying continuously for a backup datacenter that's rarely used, IaaS-based disaster recovery lets you pay for the computing resources you need only when you really need them. For example, if your primary datacenter goes down, you can create VMs running on Azure to run essential applications, then shut them down when they're no longer needed.
When multiple virtual machines are deployed through the Azure Resource Manager on the Azure cloud, administrators may often want to closely monitor the count of the VMs that are registered on the cloud and the VMs that were removed from the cloud. The Azure Virtual Machines test helps administrators in this regard.
This test auto-discovers the VMs that were deployed through the Azure Resource Manager for a target Azure subscription, and reports the numerical statistics of the VMs that were registered, added, removed, powered on and powered off etc.
Target of the Test : A Microsoft Azure Subscription
Agent deploying the test : A remote agent
Output of the test: One set of results for the Azure subscription being monitored
| Parameters | Description |
|---|---|
|
Test Period |
How often should the test be executed. |
|
Host |
The host for which the test is to be configured. |
|
Subscription ID |
Specify the GUID which uniquely identifies the Microsoft Azure Subscription to be monitored. To know the ID that maps to the target subscription, do the following:
|
|
Tenant ID |
Specify the Directory ID of the Azure AD tenant to which the target subscription belongs. To know how to determine the Directory ID, refer to Configuring the eG Agent to Monitor a Microsoft Azure Subscription Using Azure ARM REST API. |
|
Client ID, Client Password, and Confirm Password |
To connect to the target subscription, the eG agent requires an Access token in the form of an Application ID and the client secret value. For this purpose, you should register a new application with the Azure AD tenant. To know how to create such an application and determine its Application ID and client secret, refer to Configuring the eG Agent to Monitor a Microsoft Azure Subscription Using Azure ARM REST API. Specify the Application ID of the created Application in the Client ID text box and the client secret value in the Client Password text box. Confirm the Client Password by retyping it in the Confirm Password text box. |
|
Proxy Host and Proxy Port |
In some environments, all communication with the Azure cloud be routed through a proxy server. In such environments, you should make sure that the eG agent connects to the cloud via the proxy server and collects metrics. To enable metrics collection via a proxy, specify the IP address of the proxy server and the port at which the server listens against the Proxy Host and Proxy Port parameters. By default, these parameters are set to none, indicating that the eG agent is not configured to communicate via a proxy, by default. |
|
Proxy Username, Proxy Password and Confirm Password |
If the proxy server requires authentication, then, specify a valid proxy user name and password in the Proxy Username and Proxy Password parameters, respectively. Then, confirm the password by retyping it in the Confirm Password text box. |
|
Detailed Diagnosis |
To make diagnosis more efficient and accurate, the eG Enterprise embeds an optional detailed diagnostic capability. With this capability, the eG agents can be configured to run detailed, more elaborate tests as and when specific problems are detected. To enable the detailed diagnosis capability of this test for a particular server, choose the On option. To disable the capability, click on the Off option. The option to selectively enable/disable the detailed diagnosis capability will be available only if the following conditions are fulfilled:
|


| Measurement | Description | Measurement Unit | Interpretation |
|---|---|---|---|
|
Registered VMs |
Indicates the number of virtual machines that were currently registered . |
Number |
The detailed diagnosis of this measure if enabled, lists the names of the virtual machines, the location of the virtual machine, Operating system of the virtual machine, and IP address. |
|
Powered on VMs |
Indicates the number of virtual machines that are currently powered on. |
Number |
Know which virtual machines are powered on using the detailed diagnosis. |
|
Powered off VMs |
Indicates the number of virtual machines that are currently powered off. |
Number |
Use the detailed diagnosis of this measure to know which virtual machines are powered off. |
|
Added VMs |
Indicates the number of virtual machines that were newly added during the last measurement period. |
Number |
With the help of the detailed diagnosis, you can find out which VMs were recently added. |
|
Removed VMs |
Indicates the number of virtual machines that were removed during the last measurement period. |
Number |
With the help of the detailed diagnosis, you can find out which VMs were recently deleted. |
|
Other VMs |
Indicates the number of virtual machines that were in disconnected or invalid or inaccessible state during the last measurement period. |
Number |
To know which VMs are in an abnormal state currently, use the detailed diagnosis of this measure. |
The detailed diagnosis of the Registered VMs measure lists the names of the registered virtual machines, the location of the virtual machine, Operating system of the virtual machine, and IP address.
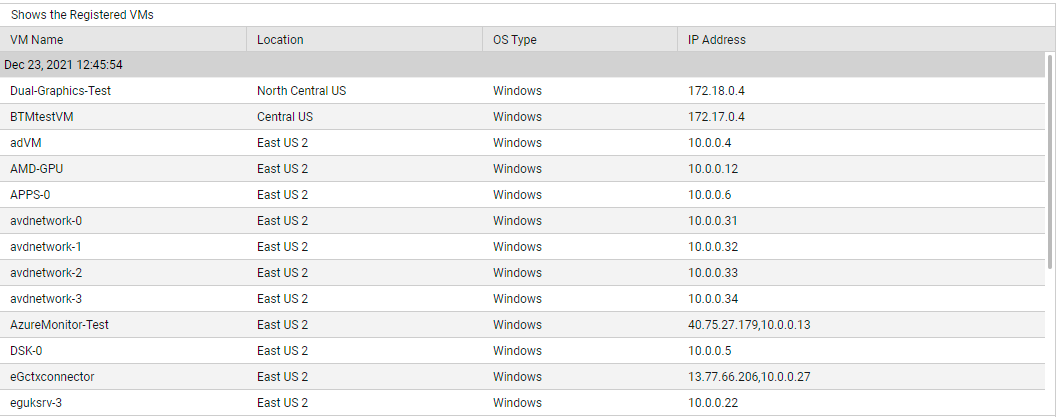
Figure 3 : The detailed diagnosis of the Registered VMs measure
Know which virtual machines are powered on, using the detailed diagnosis of the Powered on VMs measure.
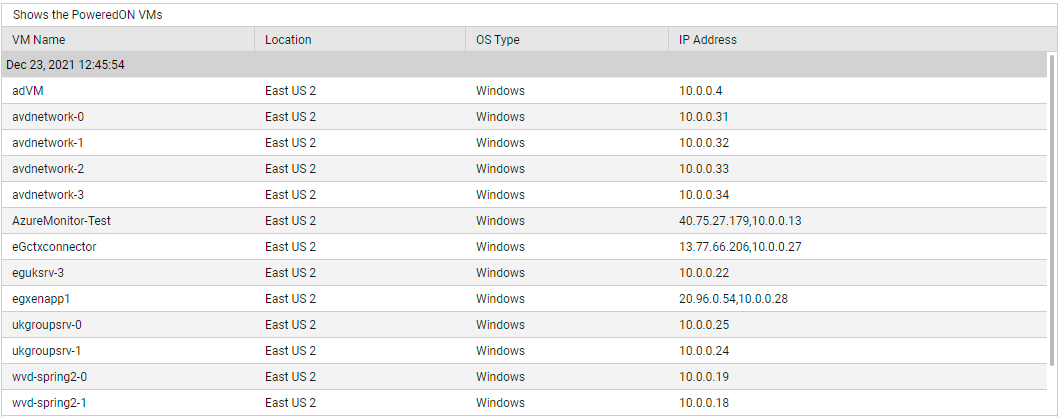
Figure 4 : The detailed diagnosis of the Powered on VMs measure
Use the detailed diagnosis of the Powered off VMs measure to know which virtual machines are powered off.
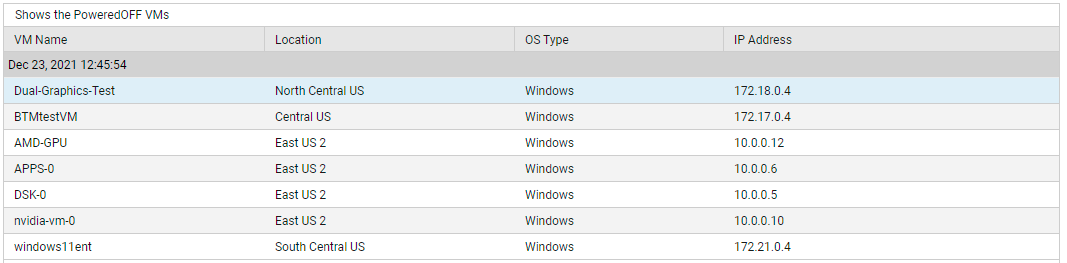
Figure 5 : The detailed diagnosis of the Powered off VMs measure
With the help of the detailed diagnosis of the Added VMs measure, you can find out which VMs were recently added.
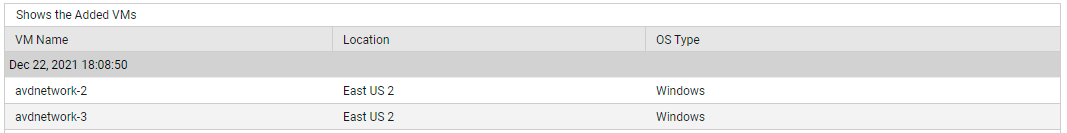
Figure 6 : The detailed diagnosis of the Added VMs measure
With the help of the detailed diagnosis of the Removed VMs measure, you can find out which VMs were recently deleted.
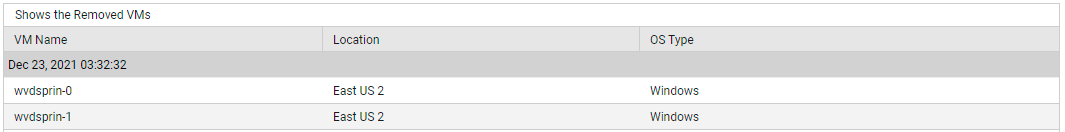
Figure 7 : The detailed diagnosis of the Removed VMs measure
To know which VMs are in an abnormal state currently, use the detailed diagnosis of the Other VMs measure.
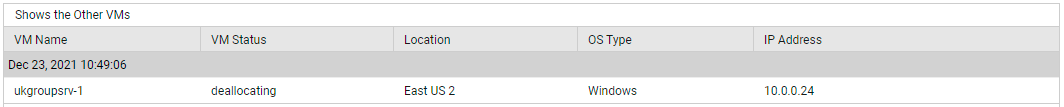
Figure 8 : The detailed diagnosis of the Other VMs measure
