Monitoring Microsoft Dynamics NAV
eG Enterprise provides a specialized Microsoft Dynamics NAV monitoring model. This model monitors the Microsoft Dynamics NAV Server computer top-down and reports on its availability and overall health.
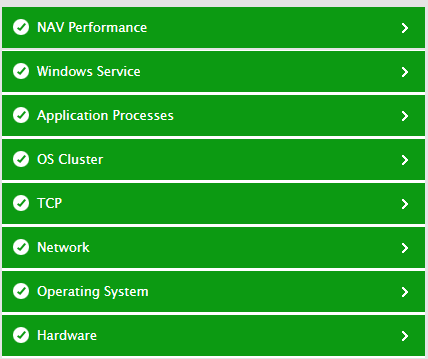
Figure 3 : Figure 1.2: Layer model of the Microsoft NAV server
Note:
The Microsoft Dynamics NAV monitoring model can monitor only Microsoft Dynamics NAV 2013.
Each layer in this model is mapped to tests that keep tabs on the health of the server host, the quality of network connections to the host, and the efficiency of the internal operations of the NAV server.
With the help of the metrics so collected, administrators can find quick and accurate answers for the following performance queries:
- Is the current session load on any NAV server instance high?
- Is any NAV server instance taking too long to process server operations? If so, which instance is it?
- Is any server instance re-executing queries on the NAV database?
- Which NAV server instance is taking too long to write to the NAV database?
- Are all NAV server instances using the preferred connection cache optimally?
- Are hits to the Calculated Fields cache very low?
- Have the commands cache, primary key cache, and the result set cache been utilized well?
- Are too many calls to the NAV service pending processing?
- Are calls failing frequently?
- At what rate do calls returns faults?
- Are calls to the service taking too long to be processed?
- Have any messages been dropped by the queued transport?
- How many messages were rejected by the queued transport?
- Were any messages received from unauthorized users?
- What is the average transaction load on the NAV service?
- Are these transactions getting aborted frequently?
The sections that follow will discuss the topmost layer of Figure 1.1 alone, as the rest of the layers have already been discussed in the Monitoring Unix and Windows Servers document.