Monitoring Exchange 2000/2003 Servers

eG Enterprise's unique layer model representation (see Figure 1) provides an intuitive and elegant way to correlate the application performance with network, CPU, memory, and disk performance, thereby allowing administrators to quickly interpret where the performance bottlenecks may be.

layermodel-final

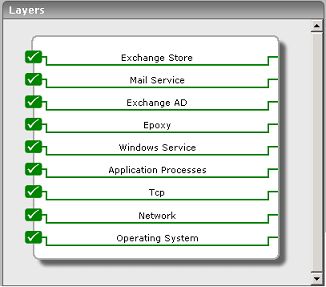
Figure 1 : Layer model of an Exchange 2000/2003 server

Data collected by the eG agents is stored in a relational database, so historical analysis and diagnosis can be performed to determine how the server can be reconfigured for optimal performance. The key performance-related questions that the data so collected helps answer, are listed in the table below.

Service Monitoring

  • Are client requests reaching the Exchange server, and is the response time acceptable?
  • Are any of the Exchange server queues indicating a malfunctioning/slow-down of the server?
  • Are RPC requests from MAPI clients being queued for processing at the Exchange server, or any change in the server's processing rate of RPC requests?
  • Is there any queue buildup at the Epoxy layer between the Exchange store and Microsoft IIS?
  • Are many retries being attempted for mail delivery?
  • Is there a significant slowdown in local mail delivery time? What is the delivery time of mail to remote locations?
  • Are there any critical errors related to Exchange in the Windowsevent logs?
  • Is the exchange database configured correctly? Are there enough log buffers, and is the cache hit ratio within acceptable limits?

Process Monitoring

  • Are the critical Exchange processes working?
  • Is any process consuming excessive CPU or memory?
  • Is there any unusual activity on the server (e.g., backup jobs, antivirus software) that can be impacting the Exchange server's performance?

Mail Traffic Monitoring

  • What is the workload on the server in terms of RPC requests from MAPI clients like Outlook?
  • Is there any unusual increase in mail traffic activity?
  • What are the peak times and how many users are connected at that time?

Network Monitoring

  • Are there network congestion/collision issues that could be slowing performance as seen by end users?
  • Is there excessive queueing of requests on any of the network interfaces of the system hosting the Exchange server?

Memory Monitoring

  • Does the system hosting the Exchange server have sufficient free memory?
  • Are there excessive page faults occurring that could be impacting performance?

Disk Monitoring

  • Is there a disk bottleneck on the system hosting the Exchange server?
  • Are there requests queued on any of the disks on the system hosting the Exchange server?
  • Are disk read/writes to any of the disks on the system very slow?
  • Is the load on the disks balanced well or is one of the disks handling a much higher load than the others?

CPU Monitoring

  • Is the system CPU on the Exchange server very heavily used?
  • Which process(es) are taking up CPU? Is there a specific time period daily when system usage tends to peak?

Active Directory Monitoring

  • Is the Exchange server able to communicate with the Active Directory server?
  • Is the length of the categorizer queue which handles requests to the global catalogs unusually high?

The sections to come describe each layer of Figure 1.