Outlook Web App Performance Test
Microsoft Outlook Web App lets users access their Exchange mailbox from almost any Web browser. In environments that span geographies or in enterprises with a liberal work culture, you will find many users accessing their mailboxes from remote locations world-wide using Outlook Web App. Moreover, in such environments, you will also find user-to-user communication enabled through an integration of Instant Messaging (IM) and OWA. To ensure a high quality user experience with the Exchange server, administrators of such environments should make sure that remote users do not complain of slowdowns / failures when accessing their mailboxes or when communicating with each other. For this, administrators should track the remote session load on OWA and IM services, gauge how well these services handle the load, proactively detect probable slowdowns in responsiveness, and fix the problem before users register a complaint with help desk. This is where the Outlook Web App Performance test helps. This test tracks the requests for OWA and IM services, measures the time taken by the Exchange server to service these requests, and brings even the slightest dips in responsiveness and the smallest of failures to the attention of administrators. This way, the test sheds light on processing bottlenecks that the OWA / IM services may be experiencing.
Target of the test : A Microsoft Exchange 2013/2016 server
Agent deploying the test : An internal agent
Outputs of the test : One set of results for the Exchange server monitored
|
| Measurement | Description | Measurement Unit | Interpretation |
|---|---|---|---|
|
Average response time: |
Indicates the average time that elapsed between the beginning and end of an OEH or ASPX request. |
Secs |
A high value for this measure is indicative of a bottleneck when processing requests to the OWA service. The detailed diagnosis of this measure, if enabled, reveals the PID of the worker process that is hogging the CPU resources and causing responsiveness to deteriorate. |
|
Average search time: |
Indicates the average time that elapsed while waiting for a search to complete. |
Secs |
A high value indicates a searching bottleneck. |
|
Proxy users: |
Indicates the number of users who are currently logged on whose mailbox access is being proxied to another server. |
Number |
|
|
Active user sessions: |
Indicates the number of users who are currently signed in to Outlook Web App. |
Number |
This is a good measure of the load on OWA. |
|
Failed outlook web app requests rate: |
Indicates the rate at which OWA requests failed. |
Reqs/Sec |
A very low value is desired for this measure. A high value is a cause for concern. |
|
Instant messages received rate: |
Indicates the rate at which instant messages were received by the server. |
Msgs/Sec |
These measures are good indicators of the load on the IM service. |
|
Instant messages sent rate: |
Indicates the rate at which instant messages were sent by the server. |
Msgs/Sec |
|
|
Percent of instant message sign in failures: |
Indicates the percentage of the last 100 users who failed to sign in to the Instant Messaging server. |
Percent |
A value close to 100% is a cause for concern, as it indicates that almost all sign-in attempts in the recent past have failed. The reasons for the anomaly will have to be investigated. |
|
Instant message sign in failures: |
Indicates the number of attempts to sign in to Instant Messaging that have failed since the service was started. |
Number |
A non-zero value is desired for this measure. |
|
Instant message delivery failures: |
Indicates the number of attempts to deliver instant messages that have failed since the service was started. |
Number |
A non-zero value is desired for this measure. |
|
Instant messages received: |
Indicates the number of instant messages that were received since the service was started. |
Number |
|
|
Instant messages sent: |
Indicates the total number of instant messages that were sent since the service was started. |
Number |
|
|
Active instant messaging users: |
Indicates the number of users who are currently signed in to Instant Messaging in Outlook Web App. |
Number |
This is a good indicator of the current workload of the IM service. |
|
Outlook web app user sessions created rate: |
Indicates the rate at which OWA user sessions were created. |
Sessions/sec |
|
|
Proxy user request rate: |
Indicates the number of proxied requests made per second. |
Reqs/Sec |
|
|
Timed out requests: |
Indicates the number of requests that timed out. |
Number |
A timeout can occur if there is already one request running from the same user and the new requests from that user could not wait longer than the configured context lock time-out period. The default timeout period setting is 3 seconds. If the value of this measure is very high, it indicates a large number of time outs. You may want to consider resetting the context lock time-out period to reduce this number. |
|
Requests handled rate: |
Indicates the rate at which requests were serviced by OWA. |
Reqs/Sec |
A high value is desired for this measure. A consistent drop in this value is indicative of a processing bottleneck. |
|
Current unique users: |
Indicates the number of unique users currently signed in to Outlook Web App. |
Number |
|
The detailed diagnosis of the Average response time measure, if enabled, reveals the PID of the worker process that is hogging the CPU resources and causing responsiveness to deteriorate.
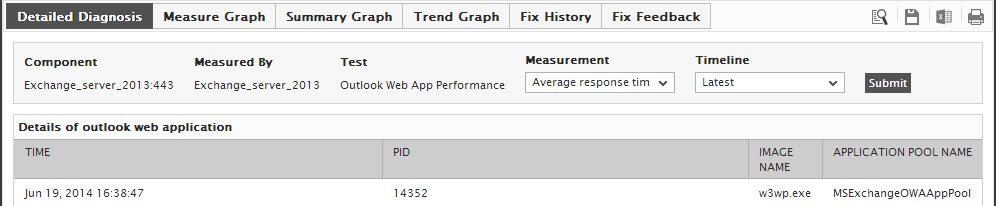
Figure 1 : The detailed diagnosis of the Average response time measure