Monitoring Microsoft RDS Servers
The Microsoft RDS Server is a server program that provides the graphical user interface (GUI) of the Windows desktop to user terminals that don't have this capability themselves. The latter include the relatively low-cost NetPC or "thin client" that some companies are purchasing as alternatives to the autonomous and more expensive PC with its own operating system and applications.
Typically, Microsoft RDS server environments involve multiple tiers of software. Domain servers in the target infrastructure handle authentication of users. Authenticated requests are passed to the Microsoft RDS servers that host a number of applications. In turn, the applications may use backend databases, printers, etc., for different functionalities. Owing to the multi-tier nature of Microsoft RDS server environments, a slow-down in one tier (e.g., the authentication server) can cause a slow-down of the entire service. When a slow-down occurs, an administrator of the server farm has to quickly determine what the source of the problem could be - i.e., Is it the network? Or the authentication server? Or the Microsoft RDS server? Or the backend database? Or the application? Accurate, fast diagnosis of problems helps reduce downtime and improve customer satisfaction.
How to Monitor All RDS Server Farms
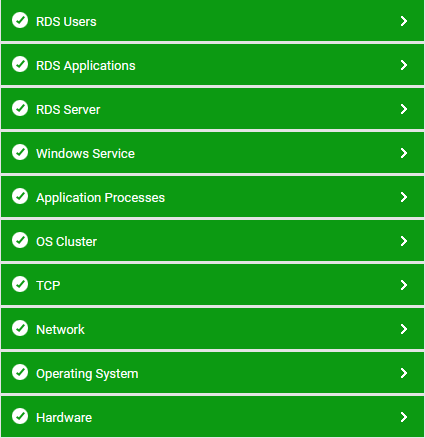
eG Enterprise offers 100% web-based monitoring of Microsoft RDS server farms. eG Enterprise includes an extensive, pre-defined, customized Microsoft RDS model for this server (see Figure 4), which defines the key performance metrics that need to be tracked to determine the service level achieved by the server/server farm.

Figure 4 : Layer model of a Microsoft RDS server
Using the metrics reported by each of the layers depicted by Figure 4, administrators can find answers to persistent performance-related queries discussed hereunder:
|
Microsoft RDS server Monitoring |
|
|
User Monitoring |
|
|
Operating System Monitoring |
|
|
Hosted Application Monitoring |
|
|
Infrastructure Services Monitoring |
|
Since the 4 layers at the bottom of Figure 4 have already been discussed in the Monitoring Unix and Windows Servers document, the sections to come will discuss the top 4 layers only.
