RDS Applications Test
This test reports statistics pertaining to the different applications deployed within the Microsoft RDS server and their usage by its clients.
Note:
This test will report metrics only if the Microsoft RDS server being monitored uses the .Net framework v3.5 (or above).
Target of the test : A Microsoft RDS server
Agent deploying the test : An internal agent
Outputs of the test : One set of results is reported for each application
| Parameters | Description |
|---|---|
|
Test period |
This indicates how often should the test be executed. |
|
Host |
The host for which the test is to be configured. |
|
Port |
Refers to the port used by the Microsoft RDS server. |
|
Apps |
By default, all is displayed here, which will auto-discover and monitor all the applications that are running from the Microsoft RDS server client. To monitor specific applications instead, you have to enter a comma separated list of processName:processPattern pairs which identify the applications published on the server being considered. processName is a string that will be used for display purposes only. processPattern is an expression of the form - *expr* or expr or *expr or expr* or *expr1*expr2*... or expr1*expr2, etc. A leading '*' signifies any number of leading characters, while a trailing '*' signifies any number of trailing characters. The pattern(s) used vary from one application to another and must be configured per application. For example, if a Microsoft Word application has been published on the Microsoft RDS server, then the Process to be specified is: Word:*winword*, where Word is the string to be displayed in the monitor interface, and *winword* is the application’s executable. Other special characters such as slashes (\) can also be used while defining the process pattern. For example, if a server’s root directory is /home/egurkha/apache and the server executable named httpd exists in the bin directory, then, the process pattern is “*/home/egurkha/apache/bin/httpd*”. The test will rediscover the applications every 6th time the test runs. |
|
Report by Domain Name |
By default, this flag is set to Yes. This implies that by default, the detailed diagnosis of this test will display the domainname\username of each user who logged into the Microsoft RDS server. This way, administrators will be able to quickly determine which user logged in from which domain. If you want the detailed diagnosis to display the username alone, then set this flag to No. |
|
Enable Browser Monitoring |
By default, this flag is set to No, indicating that the eG agent does not monitor browser activity on the Microsoft RDS server. If this flag is set to Yes, then, whenever one/more IE (Internet Explorer) browser instances on the RDS server are accessed, the detailed diagnosis of the Processes running measure will additionally reveal the URL being accessed via each IE instance and the resources consumed by every URL. Armed with this information, administrators can identify the web sites that are responsible for excessive resource usage by an IE instance. |
|
Show Active Apps Only |
Using this flag, you can indicate whether the test should monitor all applications or applications that are currently active on the server. By default, this flag is set to Yes, indicating that only the currently active applications will be monitored by the eG agent. To monitor all applications, you need to set this flag to No. |
|
Show Only Whitelist Apps |
In some highly-secure virtual environments, administrators whitelist an index of business-critical and most commonly used applications that are permitted to be present and active on the target Virtual Apps server. The goal of whitelisting is to protect the target server from potentially harmful applications and prevent any unauthorized files from executing. Application whitelisting places control over which applications are permitted to run on the target server and is controlled by the administrators, rather than the end-user. In such environments, administrators may wish to monitor only the applications that are whitelisted on the target server. To achieve this, administrators can set the Show Only Whitelist Apps flag to Yes. By default, this flag is set to No indicating that this test monitors all applications executing on the target server. By default, eG Enterprise offers a comma separated list of pre-defined applications specified against the WhiteListProcesses option in the [EXCLUDE_APPLICATIONS] section of the eg_tests.ini file available in the <eG_INSTALL_DIR>./manager/config folder. Setting the Show Only Whitelist Apps flag to Yes will enable this test to monitor only the applications that are listed against the WhiteListProcesses option. If administrators wish to add or remove one or more applications to/from this pre-defined list, then, they can do so by specifying the applications against the WhiteListProcesses option. |
|
Detailed Diagnosis |
To make diagnosis more efficient and accurate, the eG Enterprise embeds an optional detailed diagnostic capability. With this capability, the eG agents can be configured to run detailed, more elaborate tests as and when specific problems are detected. To enable the detailed diagnosis capability of this test for a particular server, choose the On option. To disable the capability, click on the Off option. The option to selectively enable/disable the detailed diagnosis capability will be available only if the following conditions are fulfilled:
|
| Measurement | Description | Measurement Unit | Interpretation |
|---|---|---|---|
|
Processes running |
Number of instances of the published application currently executing on the Microsoft RDS server |
Number |
This value indicates if too many or too few instances corresponding to an application are executing on the host. The detailed diagnosis of this measure, if enabled, displays the complete list of processes executing, the users executing them, and their individual resource utilization. |
|
CPU usage |
Percentage of CPU used by the published application |
Percent |
A very high value could indicate that the specified application is consuming excessive CPU resources. |
|
Memory usage |
This value represents the ratio of the resident set size of the memory utilized by the application to the physical memory of the host system, expressed as a percentage. |
Percent |
A sudden increase in memory utilization for an application may be indicative of memory leaks in the application. |
|
Handle count |
Indicates the number of handles opened by this application. |
Number |
A consistent increase in the handle count over a period of time is indicative of malfunctioning of programs. Compare this value across applications to see which application is using a lot of handles. |
|
Number of threads |
Indicates the number of threads that are used by this application. |
Number |
|
|
I/O data rate |
Indicates the rate at which this application is reading and writing bytes in I/O operations. |
KB/sec |
This value counts all I/O activity generated by each instance of the application and includes file, network and device I/Os. |
|
I/O data operations |
Indicates the rate at which this application is issuing read and write data to file, network and device I/O operations. |
Operations/sec |
|
|
I/O read data rate |
Indicates the rate at which this application is reading data from file, network and device I/O operations. |
KB/sec |
|
|
Page fault rate |
Indicates the number of page faults generated by this application per second. |
Faults/sec |
Page faults are generated when an application tries to use memory that is part of its working set, but can't find it. Page faults can be either hard or soft:
Compare values across the applications to figure out which application is generating most page faults. |
|
Private working set memory |
Indicates the total amount memory that is dedicated to this application, and cannot be shared among other applications on the server. |
MB |
|
|
Input delay for processes - max |
Indicates the maximum amount of time lag detected between the user's input through any input device (e.g., mouse, keyboard) and the time at which this application detected the input. |
Seconds |
These measures will be reported only for the Windows 2019 desktops on the target server. Ideally, the values of these measures should be very low. High values for these measures can impact the speed of accessing the applications in the environment and badly degrade the overall user experience.
|
|
Input delay for processes - avg |
Indicates the average amount of time lag detected between the user's input through any input device (e.g., mouse, keyboard) and the time at which this application detected the input. |
Seconds |
The detailed diagnosis of the Processes running measure, if enabled, provides the list of processes currently executing, the users executing them, and their CPU and memory usage. Using these details, you can quickly detect resource-intensive instances and the user executing them.
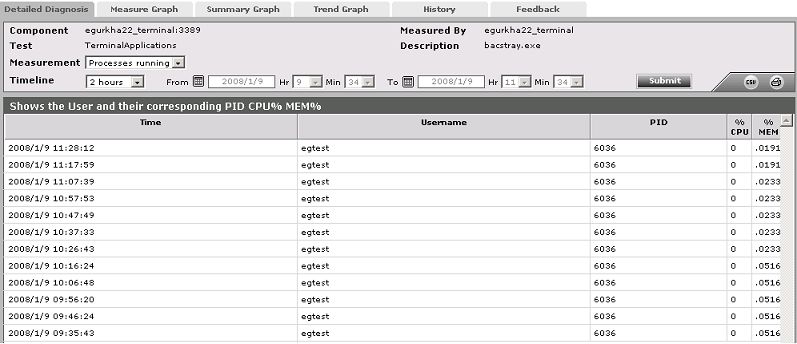
Figure 1 : The detailed diagnosis of the Processes running measure
Moreover, if one or more browser instances are found to consume excessive CPU, memory and disk I/O resources on a server or a desktop, then for each such browser instance, administrators can now see a mapping of browser process to URL being accessed, as well as the resources used by each browser process in the detailed diagnosis. Armed with this information, administrators can determine the steps required to avoid excessive resource usage by browser instances – e.g., whether specific web sites are responsible for this, whether users are accessing web sites (e.g., youtube, facebook, etc.) that they should not be accessing from a corporate network, etc.
Note:
- The eG agent will perform browser activity monitoring only if the enable browser monitoring flag is set to Yes.
- The eG agent will monitor browser activity only of the browser being accessed is Internet Explorer.