RDS Users Test
A Microsoft RDS server environment is a shared environment in which multiple users connect to a server/server farm and access a wide variety of applications. When server resources are shared, excessive resource utilization by a single user could impact the performance for other users. Therefore, continuous monitoring of the activities of each and every user on the server is critical. Towards this end, the RDS Users test assesses the traffic between the user terminal and the server, and also monitors the resources taken up by a user's session on the server. The results of this test can be used in troubleshooting and proactive monitoring. For example, when a user reports a performance problem, an administrator can quickly check the bandwidth usage of the user's session, the CPU/memory/disk usage of this user's session as well as the resource usage of other user sessions. The admin also has access to details on what processes/applications the user is accessing and their individual resource usage. This information can be used to spot any offending processes/ applications.
Note:
This test will report metrics only if the Microsoft RDS server being monitored uses the .Net framework v3.5 (or above).
Target of the test : A Microsoft RDS server
Agent deploying the test : An internal agent
Outputs of the test : One set of results for every user logged into the Microsoft RDS server
| Parameters | Description |
|---|---|
|
Test period |
This indicates how often should the test be executed. |
|
Host |
The host for which the test is to be configured. |
|
Port |
Refers to the port used by the Microsoft RDS server. |
|
Usernames |
Specify the name of the user whose performance statistics need to be generated. Multiple user names can be specified as a comma-separated list. all is used to indicate that all users of the Microsoft RDS server are to be monitored. |
|
Report by Domain Name |
By default, this flag is set to Yes. This implies that by default, this test will report metrics for every domainname\username. This way, administrators will know which user logged in from which domain. If you want the test to report metrics for every username only, then set this flag to No. |
|
Enable Browser Monitoring |
By default, this flag is set to No, indicating that the eG agent does not monitor browser activity on the Microsoft RDS server. If this flag is set to Yes, then, whenever one/more IE (Internet Explorer) browser instances on the RDS server are accessed, the detailed diagnosis of the User sessions measure will additionally reveal the URL being accessed via each IE instance and the resources consumed by every URL. Armed with this information, administrators can identify the web sites that are responsible for excessive resource usage by an IE instance. |
|
Detailed Diagnosis |
To make diagnosis more efficient and accurate, the eG Enterprise embeds an optional detailed diagnostic capability. With this capability, the eG agents can be configured to run detailed, more elaborate tests as and when specific problems are detected. To enable the detailed diagnosis capability of this test for a particular server, choose the On option. To disable the capability, click on the Off option. The option to selectively enable/disable the detailed diagnosis capability will be available only if the following conditions are fulfilled:
|
| Measurement | Description | Measurement Unit | Interpretation |
|---|---|---|---|
|
User sessions |
Represents the current number of sessions for a particular user |
Number |
A value of 0 indicates that the user is not currently connected to the Microsoft RDS server. |
|
CPU usage of user’s processes |
The CPU utilization for a session is the percentage of time that all of the threads/processes of a user session used the processor to execute instructions. If a user is connected via multiple sessions, the value reported is the sum of all cpu utilizations across all the sessions. |
Percent |
This value indicates the percentage of Cpu resources that are used by applications run by this user. Excessive CPU usage by a user can impact performance for other users. Check the detailed diagnosis to view the offending processes/applications. |
|
Memory usage of user’s processes |
This value represents the ratio of the resident set size of the memory utilized by the user to the physical memory of the host system, expressed as a percentage. If a user is connected via multiple sessions, the value reported is the sum of all memory utilizations across all the sessions. |
Percent |
This value indicates the percentage of memory resources that are used up by a specific user. By comparing this value across users, an administrator can identify the most heavy users of the Microsoft RDS server. Check the detailed diagnosis to view the offending processes/applications. |
|
Input bandwidth |
Indicates the average bandwidth used for client to server communications for all the sessions of a user |
KB/Sec |
|
|
Input errors |
The average number of input errors of all types for all the sessions of a user. Example: Lost ACK's, badly formed packets, etc. |
Errors/Sec |
|
|
Output bandwidth |
Indicates the average bandwidth used for server to client communications for all the sessions of a user |
KB/Sec |
|
|
Output errors |
The average number of output errors of all types for all the sessions of a user. Example: Lost ACK's, badly formed packets, etc. |
Errors/Sec |
|
|
I/O read rate for user’s processes |
Indicates the rate of I/O reads done by all processes being run by a user. |
KBps |
These metrics measure the collective I/O activity (which includes file, network and device I/O's) generated by all the processes being executed by a user. When viewed along with the system I/O metrics reported by the DiskActivityTest, these measures help you determine the network I/O. Comparison across users helps identify the user who is running the most I/O-intensive processes. Check the detailed diagnosis for the offending processes/applications. |
|
I/O write rate for user’s processes |
Indicates the rate of I/O writes done by all processes being run by a user. |
KBps |
|
|
Faults for user’s processes |
Indicates the rate of page faults seen by all processes being run by a user. |
Faults/Sec |
Page Faults occur in the threads executing in a process. A page fault occurs when a thread refers to a virtual memory page that is not in its working set in main memory. If the page is on the standby list and hence already in main memory, or if the page is in use by another process with whom the page is shared, then the page fault will not cause the page to be fetched from disk. Excessive page faults could result in decreased performance. Compare values across users to figure out which user is causing most page faults. |
|
Virtual memory of user’s processes |
Indicates the total virtual memory being used by all processes being run by a user. |
MB |
Comparison across users reveals the user who is being a drain on the virtual memory space. |
|
Handles used by user’s processes |
Indicates the total number of handles being currently held by all processes of a user. |
Number |
A consistent increase in the handle count over a period of time is indicative of malfunctioning of programs. Compare this value across users to see which user is using a lot of handles. Check detailed diagnosis for further information. |
|
CPU time used by user’s sessions |
Indicates the percentage of time, across all processors, this user hogged the CPU.
|
Percent |
The CPU usage for user’s processes measure averages out the total CPU usage of a user on the basis of the number of processors. For instance, if your Microsoft RDS server is using an 8-core processor and the total CPU usage of a user across all his/her sessions amounts to 80%, then the value of the CPU usage for user’s processes measure for that user will be 10 % (80/8 processors = 10). This accurately denotes the extent of CPU usage in an environment where load is uniformly balanced across multiple processors. However, in environments where load is not well-balanced, the CPU usage for user’s processes measure may not be an accurate indicator of CPU usage per user. For instance, if a single processor is used nearly 80% of the time by a user, and other 7 processors in the 8-core processor environment are idle, the CPU usage for user’s processes measure will still report CPU usage as 10%. This may cause administrators to miss out on the fact that the user is actually hogging a particular processor! In such environments therefore, its best to use the CPU time used by user’s sessions measure! By reporting the total CPU usage of a user across all his/her sessions and across all the processors the target Microsoft RDS server supports, this measure serves as the true indicator of the level of CPU usage by a user in dynamic environments. For instance, in the example above, the CPU time used by user’s sessions of the user will be 80% (and not 10%, as in the case of the CPU usage for user’s processes measure). A high value or a consistent increase in the value of this measure is hence serious and demands immediate attention. In such situations, use the detailed diagnosis of the CPU usage for user’s processes measure to know what CPU-intensive activities are being performed by the user. |
|
Input delay for user's sessions - max |
Indicates the maximum amount of time lag detected between this user's input through any input device (e.g., mouse, keyboard) and the time at which the application detected the input. |
Seconds |
These measures will be reported only for the Windows 2019 desktops on the target RDS server. Ideally, the values of these measures should be very low. High values for these measures can impact the speed of accessing the applications in the environment and seriously degrade the overall user experience.
|
|
Input delay for user's sessions - avg |
Indicates the average amount of time lag detected between this user's input through any input device (e.g., mouse, keyboard) and the time at which the application detected the input. |
Seconds |
The detailed diagnosis of the User sessions, CPU usage of user’s processes, and Memory usage of user’s processes measures lists the processes executed by a user on the Microsoft RDS server, and reports the resource usage of each process (see Figure 1).
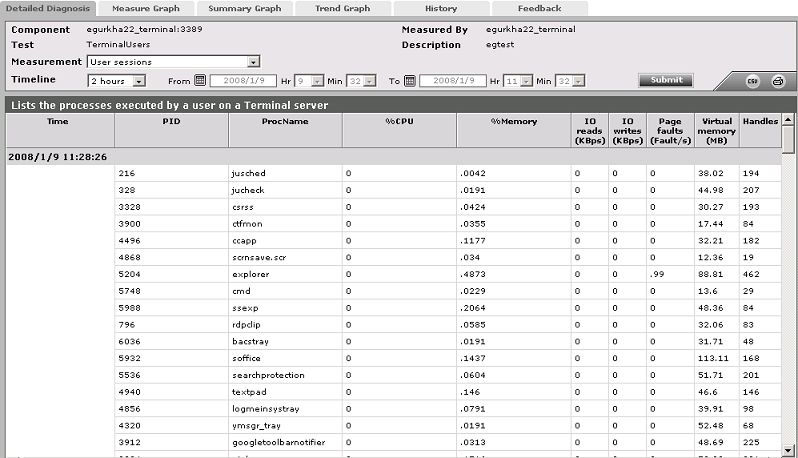
Figure 1 : The detailed diagnosis of the User sessions measure
Where one/more instances of the Internet Explorer browser are running, the detailed diagnosis additionally displays the website URL accessed using each IE instance, the domain of every URL, and the website title. In the event of excessive resource usage by an IE instance, this information will shed light on the resource-intensive web site that was being accessed.
Note:
- The eG agent will perform browser activity monitoring only if the Enable Browser Monitoring flag is set to Yes.
- The eG agent will monitor browser activity only of the browser being accessed is Internet Explorer.