Monitoring the Microsoft Azure SQL Database Using eG Enterprise

The pre-built Microsoft Azure SQL database monitoring model that eG Enterprise offers, provides in-depth monitoring for it.
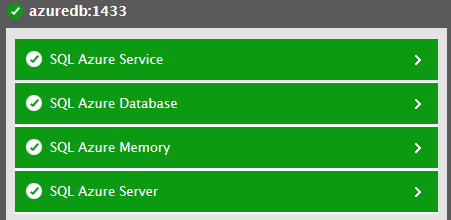
Figure 5 : The layer model for the Microsoft SQL Azure Database

Each of the layers of this hierarchical model reports a wide variety of metrics revealing the health of the Azure SQL database service.

Database Service Monitoring

  • Is the database server available for servicing requests?
  • What is the response time for a typical query?
  • Did the service reboot/restart frequently?

Database Engine Monitoring

  • What is the CPU utilization of the Azure SQL engine?
  • How much time is the databse service spending on processing vs. I/O?
  • What is the typical workload on the database service?

Lock Waits Monitoring

  • Have any lock wait events been captured on the database? What type of lock waits are these?
  • Have any lock wait events been active for too long a time on the database?

Database Space Monitoring

  • Are any tables occupying too much database space? Which ones are those?

Database Indexing Activity

  • Are there any unused indexes on the database?
  • Are any indexes missing?
  • Are any indexes highly/very highly fragmented?

Database Querying

  • Are any resource-intensive queries running on the database? Which ones are they?
  • Which are the queries that have been running for an unusually long time?
  • Were any query wait events noticed on the database recently? If so, which queries caused the waits?
  • Are any query plans consuming memory abnormally?

Database Blocking

  • Are there any root blockers? If so, which are the root blocker processes and which queries are they running? Which processes are being blocked for the longest time?

Database Sessions

  • Are any sessions to the database blocked / pending / dormant / suspended / rolled back? Which sessions are in any of the aforesaid abnormal states?

Database Resource Usage

  • Is the database consuming CPU/memory/I/O excessively?
  • Was any delay noticed when granting memory to queries? Which queries have been waiting too long for memory?