Configuring the eG Agent to Collect Usage Analytics
SharePoint Usage and Health Service application is a feature to analyze usage of SharePoint environment or troubleshooting SharePoint Issues. This application can be configured to collect two types of data: Usage data and Health data. The following tests use the Usage data collected by the application to report metrics:
- Site Usage Analytics test
- Web Application Usage Analytics test
- Browser Usage Analytics test
- User Analytics test
- Distributed Cache Usage Analytics test
- Critical and Slow Web Parts test
Usage data is about usage on SharePoint Farm, like page requests, feature use, search query latency, etc. This data is similar to IIS log, however unlike IIS logs this has additional SharePoint specific data collected like Application ID, Site ID, Web ID, Correlation ID etc. Usage data is initially stored in Usage Log file (.USAGE ) on SharePoint Server under logging directory which is later processed by Microsoft SharePoint Foundation Usage Data Import Timer job into Usage Database. Each of the tests above query the Usage Database at configured intervals to collect the metrics they require.
For these tests to run, the following pre-requisites should be fulfilled:
- A SharePoint Usage and Health Service Application should be created on the target SharePoint server;
- Usage and Health data collection should be enabled for this application
- The eG agent on the SharePoint server should be allowed to query the Usage database.
Each of these steps are detailed below.
Creating a SharePoint Usage and Health Service Application
For this, do the following:
- Login to the target SharePoint server as a user with Farm administrator privileges.
- Open the SharePoint management shell.
-
Then, run the following commands one after another:
Add-PSSnapin Microsoft.SharePoint.PowerShell
New-SPUsageApplication -Name "<Name_of_application>"
For example, your command can be:
Add-PSSnapin Microsoft.SharePoint.PowerShell
New-SPUsageApplication -Name "SharePointUsageApp"
If the command executes successfully, then your output will reveal the name of the application you created, the application type, and the application ID.

Figure 1 : Output of the command issued for creating a SharePoint Usage and Health application
-
Next, open the SharePoint management console and follow the node sequence, Central Administration -> Application Management -> Manage service applications, on the console. Figure 2 will then appear. Click the Manage service applications option under Service Applications in Figure 2.
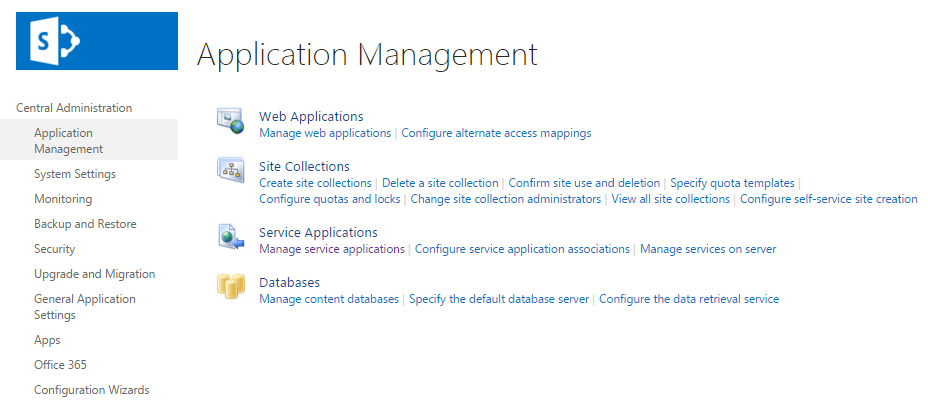
-
When Figure 3 appears, look for an entry for the new Usage and Health application you created at step 3 above. If its available therein, it is a clear indicator that the new application has been created successfully.
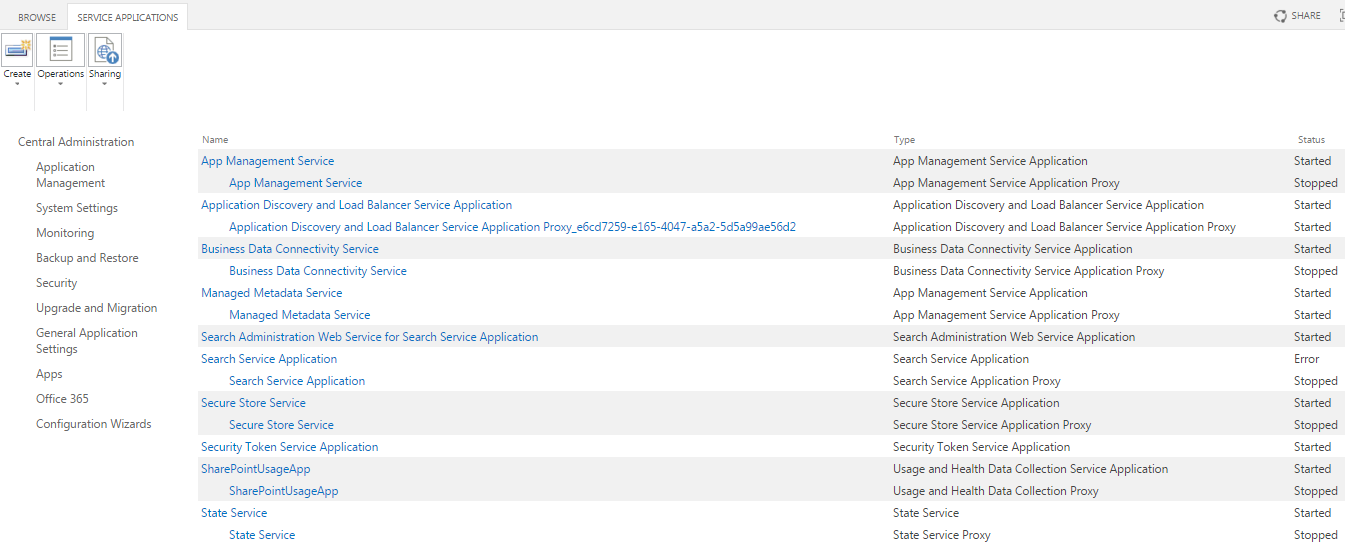
Figure 3 : Looking for an entry for the new Usage and Health application you created
Enabling Usage and Health Data Collection
To achieve this, follow the steps below:
-
In the SharePoint management console, select the Monitoring node under Central Administration. Then, click on the Configure usage and health data collection option under Reporting (see Figure 4).
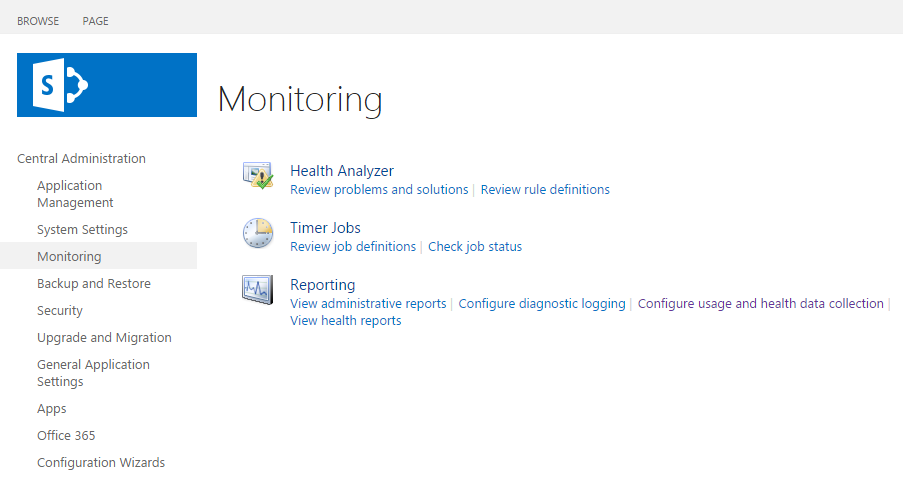
Figure 4 : Selecting the Configure usage and health data collection option
-
When Figure 5 appears, select the Enable usage data collection checkbox therein.
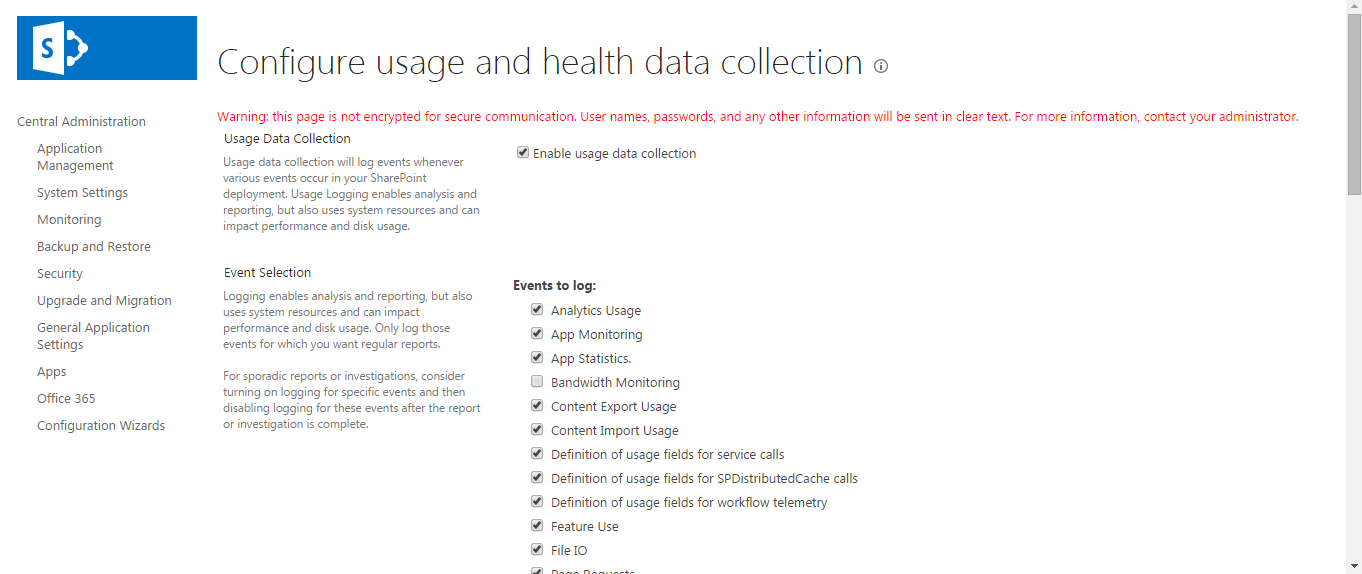
-
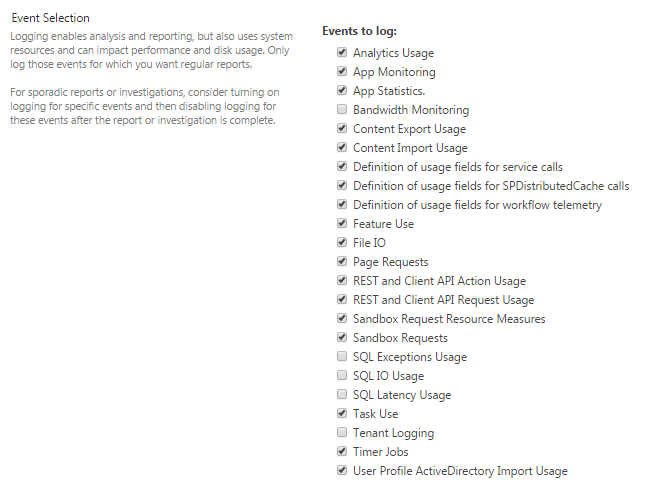
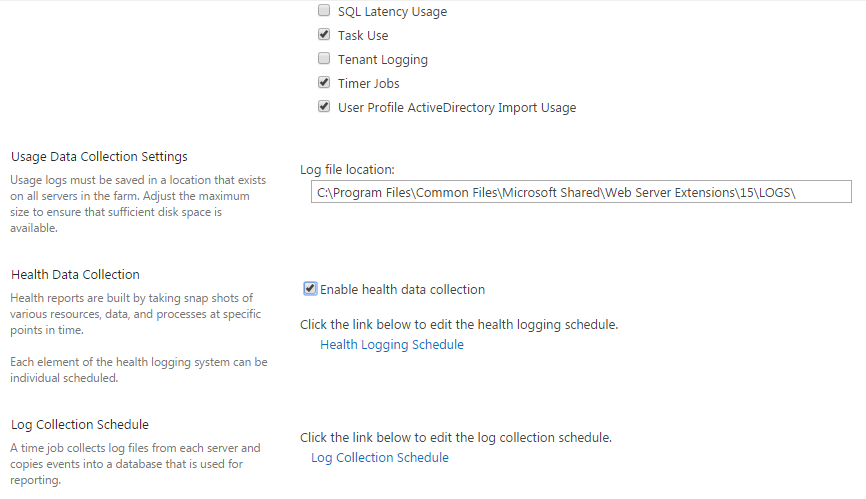
Under the Events to log section, make sure that the default selections (indicated by Figure 6 and Figure 7) are not disturbed.
-
Scroll down Figure 6, and then select the Enable health data collection check box that becomes visible (see Figure 7).
-
Scroll further down Figure 7 until the Database Server and the Database Name fields visible (see Figure 8). Copy the values of these fields to a text editor. Make sure that the database server and database name parameters of the analytics tests are configured with the copied values only.
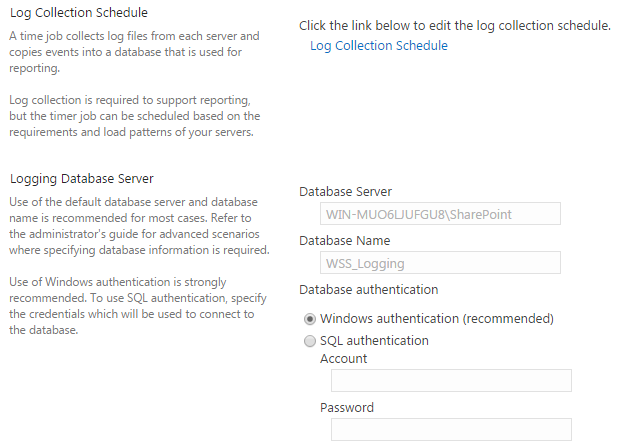
Figure 8 : The name of the SQL server hosting the usage database and the name of the usage database
Note that, over time, the database in which health data is stored (i.e., the WSS_Logging database in the example of Figure 8 above) can grow considerably and can create storage concerns for any SQL database administrator. To avoid this, it is best to reduce the data retention period. Refer to Reducing Data Retention Policy for Logging Database to know how.
Reducing Data Retention Policy for Logging Database
By default, the retention period is set to 14 days. To reduce it, follow the steps below:
-
Run the following PowerShell commands, one after another:
$defs = Get-SPUsageDefinition
Foreach($def in $defs)
{
Set-SPUsageDefinition –Identity $def.Name –DaysRetained <Retention_period_in_days>
}
For instance, if you want to reduce the retention period to 3 days, then the commands will be as follows:
$defs = Get-SPUsageDefinition
Foreach($def in $defs)
{
Set-SPUsageDefinition –Identity $def.Name –DaysRetained 3
}
-
Next, in the SharePoint management console, select the Monitoring node under Central Administration. Then, click on the Configure usage and health data collection option under Reporting, and navigate to Log Collection Schedule. Then, execute the following timer jobs:
Microsoft SharePoint Foundation Usage Data Import
Microsoft SharePoint Foundation Usage Data Processing
-
The SQL logging database will now contain some free space which your SQL DBA can ‘free-up’ within SQL Management Studio or running the ‘DBCC ShrinkFile’ T-SQL command.