Search Flow Test
Content processing in SharePoint is performed by the content processing component (CPC) and the index component.
The Content Processing Component (CPC) uses Flows and Operators to process the content (see Figure 1). Flows define how to process content, queries and results and each flow processes one item at a time. Flows consist of operators and connections organized as graphs. This is where activities like language detection, word breaking, security descriptors, content enrichment (web service callout), entity and metadata extraction, deep link extraction and many others take place. The flow has branches that handle different operations, like inserts, deletes and partial updates.
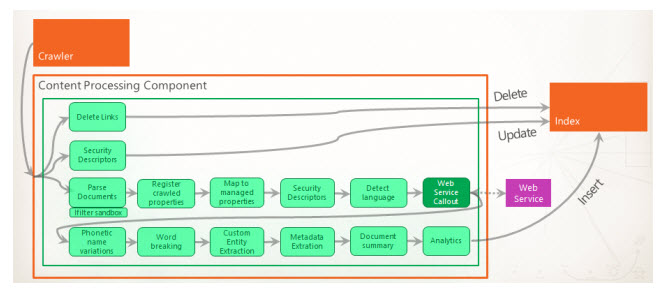
Figure 1 : Flows and operators in CPC
Once content is processed by the CPC, the index component receives the processed items from the CPC and writes them to the search index. The index component also handles incoming queries, retrieves information from the search index, and sends back the result set to the query processing component.
Whether it is the CPC that fails to process the content rapidly or the index component that writes to the index slowly, what suffers is the end-user’s experience with SharePoint search! To ensure that SharePoint delivers to users a fast and flawless searching experience, administrators should not only be able to detect slowdowns before they impact query processing, but also tell where the slowdown originated – is it with the CPC or the index component? The Search Flows test answers this question accurately! This test monitors the flows on CPC, keeps track of documents that are in queue waiting to be processed by the flows, and reports how quickly the CPC and the index component process the enqueued contents. While at it, the test points to potential bottlenecks in content processing and accurately isolates the source of the bottleneck – is it the CPC or the index component?
Note:
This test will report metrics only if the Content Processing Component and the index component are available on the target SharePoint server.
Target of the test : A Microsoft SharePoint Server
Agent deploying the test : An internal agent
Outputs of the test : One set of results each for the Microsoft SharePoint server that is being monitored
| Parameters | Description |
|---|---|
|
Test period |
This indicates how often should the test be executed. |
|
Host |
The host for which the test is to be configured. |
|
Port |
The port at which the host server listens. |
| Measurement | Description | Measurement Unit | Interpretation |
|---|---|---|---|
|
Total inbound items |
Indicates the total number of items placed on input queues. |
Number |
|
|
Items queued for processing |
Indicates the number of items that are currently in queues in front of input operators that are ready for processing. |
Number |
A high value or a consistent increase in the value of this measure is indicative of bottlenecks in content processing. |
|
Active threads |
Indicates the number of threads that are currently active. |
Number |
|
|
Input queue empty time |
Indicates the total time spent by input operators waiting for items. |
Millisecs |
If this value is low (say, less than a thousand), it indicates that the input queues are rarely ever empty! You may then want to check the processor usage on the CPC component. If this is very high, it is a clear indication that the CPC is stressed and could be the key contributor to the slowdown in content processing. On the other hand, if the value of this measure is high (say, over a thousand) , it indicates that the input queues are empty for long time spells. This implies that the CPC is processing content quickly. In this case, check the disk I/O and latency on the index component. If these parameters are high, it implies that the index component is stressed and is unable to handle the load imposed by the CPC. You can thus conclude that the bottleneck lies with the index component. |
|
Input queue full time |
Indicates the total time spent waiting for space to become available on input queues. |
Millisecs |
If this value is high (say, over a thousand), it indicates that the CPC is taking a long time to process the contents in the input queues and free up the queues! You may then want to check the processor usage on the CPC component. If this is very high, it is a clear indication that the CPC is stressed and could be the key contributor to the slowdown in content processing. On the other hand, if the value of this measure is low (say, less than a thousand), it indicates that the input queues are getting cleared very quickly. This implies that the CPC is processing content quickly. In this case, check the disk I/O and latency on the index component. If these parameters are high, it implies that the index component is stressed and is unable to handle the load imposed by the CPC. You can thus conclude that the bottleneck lies with the index component. |