Search Gatherer Threads Test
Search in SharePoint 2013 enables users to find relevant information more quickly and easily than ever before and makes it easy for Search administrators to customize the search experience.
The search architecture consists of the following areas:
- Crawl and content processing
- Index
- Query processing
- Search administration
- Analytics
Figure 1 depicts how these components work together to implement the search functionality in SharePoint 2013.
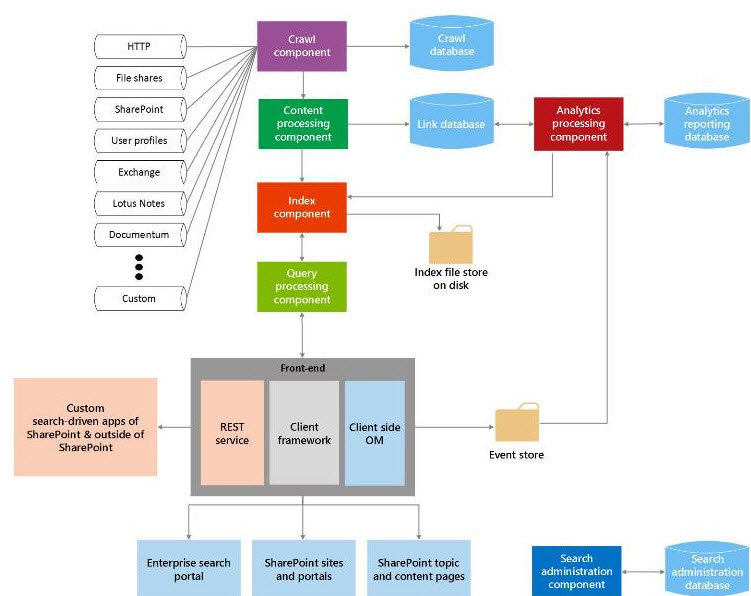
Figure 1 : How search works in SharePoint 2013?
From Figure 1, it is clear that the crawl component lays the foundation for the search mechanism! The crawl component crawls content sources to collect crawled properties and metadata from crawled items and sends this information to the content processing component. This means that if the crawl component is unable to crawl the content hosts, it could impact the speed of every dependent operation – be it content processing, indexing, query processing etc. – thereby crippling the entire search engine! Hence, for search in SharePoint 2013 to be quick and efficient, administrators should primarily keep an eye on the crawl component, swiftly isolate painpoints in crawling, and clear them rapidly. To achieve this, administrators can use the Search Gatherer Threads test. This test monitors the crawling process and reveals how well the crawling worker threads are doing their jobs. While at it, the test proactively notifies administrators of a potential slowdown (if any) n crawling and pinpoints what is causing the slowdown – a hungry content host? or improperly configured crawls? .
Note:
This test will report metrics only if the crawl component is available on the target SharePoint server.
Target of the test : A Microsoft SharePoint Server
Agent deploying the test : An internal agent
Outputs of the test : One set of results each for the Microsoft SharePoint server that is being monitored
| Parameters | Description |
|---|---|
|
Test period |
This indicates how often should the test be executed. |
|
Host |
The host for which the test is to be configured. |
|
Port |
The port at which the host server listens. |
| Measurement | Description | Measurement Unit | Interpretation |
|---|---|---|---|
|
Threads accessing the network |
Indicates the number of threads that are waiting on the content host to return the requested content. |
Number |
If this number is consistently high then you are either network bound or you are bound by a "hungry" host. If you are not meeting your crawl freshness goals, you can either change your crawl schedules to minimize overlapping crawls or look at the remote repositories you are crawling to optimize them for more throughput. |
|
Filtering threads |
Indicates the current number of filtering threads in the system. |
Number |
If the value of the Threads accessing the network measure is close to that of the Filtering threads measure, it is an indication that a bottleneck exists at the content source/host. When this happens, you may also want to check whether processor usage on the crawl component servers is low. Likewise, look for disk latency issues on the crawl database. If all the above exist, it is a clear indicator that the content host/source is where the bottleneck lies! |
|
Idle threads |
Indicates the number of threads that are currently waiting for documents. |
Number |
These threads are not currently doing any work and will eventually be terminated. If you consistently have a more than Max Threads/Hosts idle threads you can schedule an additional crawl. If this number is 0 then you are starved. Do not schedule another crawl in this time period and analyze the durations of your crawls during this time to see if they are meeting your freshness goals. If your goals are not being met you should reduce the number of crawls. |