How does eG Enterprise Monitor Mikrotik Router?
eG Enterprise monitors the Mikrotik Router in an agentless manner. For this purpose, an eG external agent is deployed on any remote host in the environment. This agent communicates with the Mikrotik router and collects the performance metrics by executing the CLI commands on the router and also from the SNMP MIB of the router. To collect metrics from the SNMP MIB, eG agent requires the router to be SNMP enabled.
Managing the Mikrotik Router
To configure a router for monitoring by the eG Enterprise:
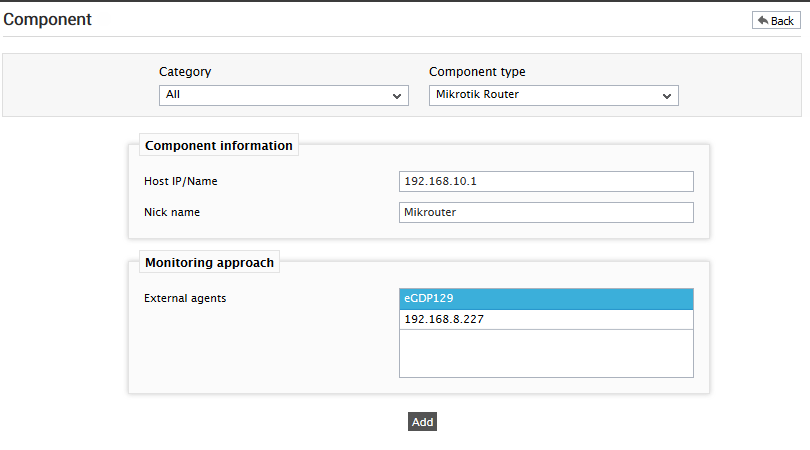
- Log into the eG administrative interface.
-
If the router is already discovered, then directly proceed towards managing it using the COMPONENTS - MANAGE/UNMANAGE page (Infrastructure -> Components -> Manage/Unmanage). However, if it is yet to be discovered, then run discovery (Infrastructure -> Components -> Discovery) to get it discovered or add the router manually using the COMPONENTS page (Infrastructure -> Components -> Add/Modify). Remember that components manually added are managed automatically. Discovered components, however, are managed using the COMPONENTS - MANAGE/UNMANAGE page.
-
Now, attempt to sign out of the eG administrative interface. Doing so will result in the display of Figure 2, which lists all the unconfigured tests of the Mikrotik Router.
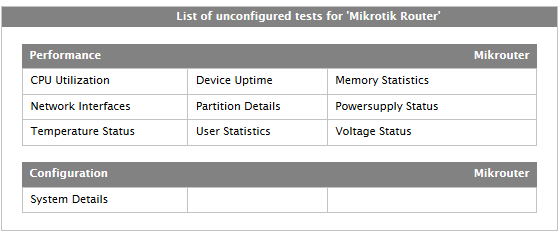
Figure 2 : List of unconfigured tests for the Mikrotik router
-
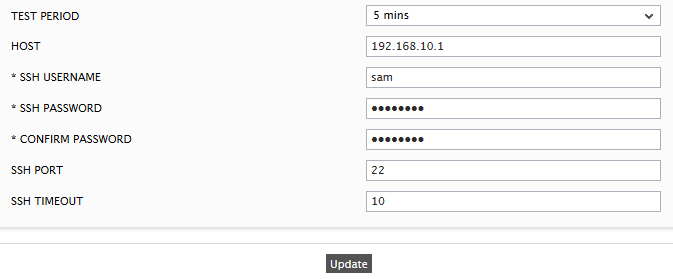
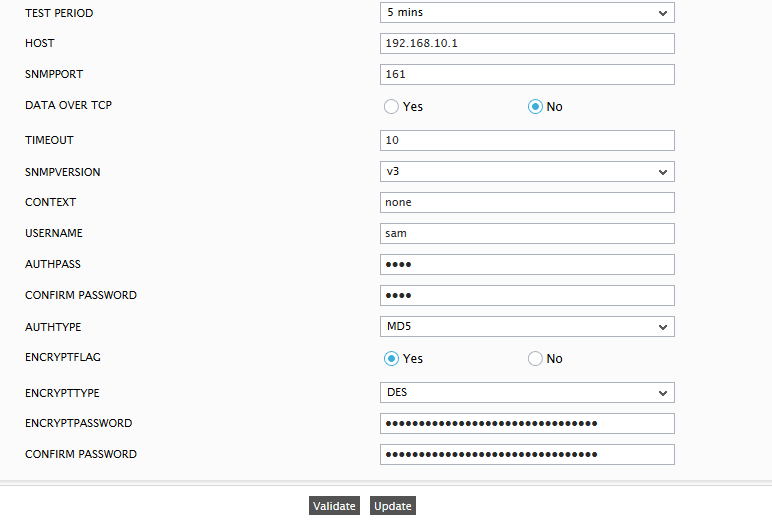
Click the CPU Utilization Test to configure the test. Figure 3 then appears.
-
Then, signing out of the eG administrative interface will prompt you to configure a few more tests as shown in Figure 4.
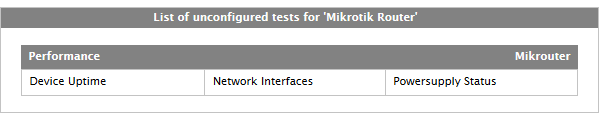
Figure 4 : The list of unconfigured tests for the Mikrotik router
-
Click the Powersupply Status Test to configure it. Figure 5 then appears.
- Finally, signout of the eG administrative interface.