Monitoring the MongoDB Server Using eG Enterprise
eG Enterprise provides a specialized monitoring model for a MongoDB server instance, with the help of which administrators can keep a constant check on the availability and overall performance of that instance.
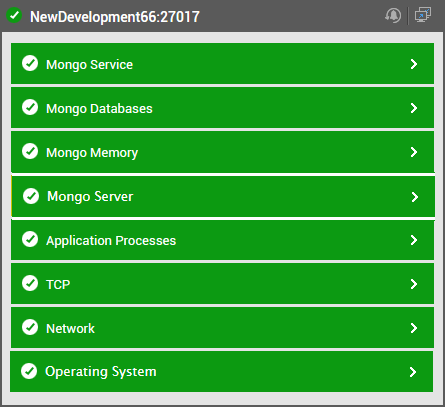
Figure 1 : The layer model of a MongoDB server instance
Each layer of Figure 1 above is mapped to tests that provide deep insights into how the MongoDB server instance manages connections to it, the space at its disposal, locks, indexes, transactions, user sessions, and in the process provides effective pointers to how the server can be fine-tuned to perform better.
The metrics reported by these tests help answer the following performance questions:
- Is the MongoDB server up and running? If so, how well is it responding to requests?
- Is connection to the server available? Is there a delay in connecting to the server?
- Are there adequate free connections to the server?
- How frequently do assertions occur? What type of assertions are common?
- Are writes been flushed to disk quickly?
- Is the cache sized right?
- Are all databases available? Which database is presently unavailable?
- Is any database locked for an unusually long time? If so, which collection(s) in that database was for the maximum time?
- Is any database slow in processing queries? If so, which one is it?
- Are there too many open cursors on the server?
- Is any database running short of database space? If so, which one is it?
- Is any database growing alarmingly in size? Which database is it? Which collection in this database is is contributing to this growth?
- Is the compression ratio of any database poor?
- Are too many requests waiting in queue for a lock?
-
Are requests waiting too long for locks? What type of locks do they often wait for?
- Are many queries not been serviced by indexes?
- Is journaling taking too long than usual? If so, where does the bottleneck lie - when writing to the journal? when committing the writes? or when writing to the datafiles?
- Were many errors and warnings captured by the log files recently? What type of errors or warnings are these?
- Is the MongoDB server instance utilizing memory excessively?
- Were many page faults detected?
- Are requests to the server consuming bandwidth excessively?
- Has a primary node in a replica set failed over to the secondary node?
- Is any member node in a replica set not running currently?
- Is the replication time lag abnormally high between the primary and secondary?
- Is the server overloaded with requests? What type of operations are overloading the server?
- Are tickets used optimally or is the server running out of free tickets?
- Are transaction rollbacks kept at a minimum?
- Are checkpoints created regularly?