AWS CloudFront - Content Delivery Network Test
Amazon CloudFront is a web service that speeds up distribution of your static and dynamic web content, such as .html, .css, .js, and image files, to your users. CloudFront delivers your content through a worldwide network of data centers called edge locations. When a user requests content that you're serving with CloudFront, the user is routed to the edge location that provides the lowest latency (time delay), so that content is delivered with the best possible performance.
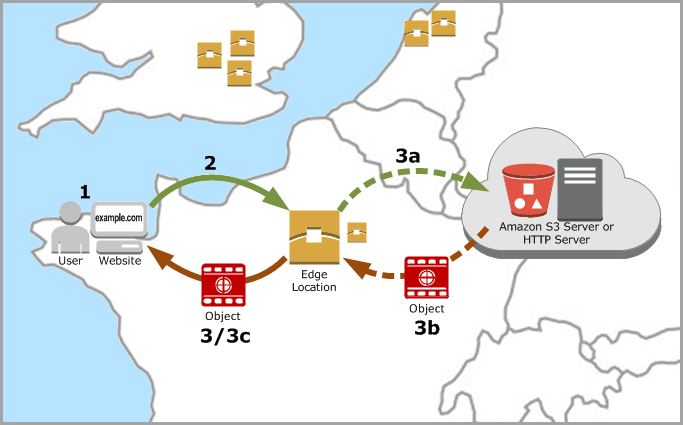
In the edge location, CloudFront checks its cache for the requested files. If the files are in the cache, CloudFront returns them to the user. If the files are not in the cache, it does the following:
-
CloudFront compares the request with the specifications in your distribution. A distribution is where you can specify configuration settings such as:
- Your origin, which is the Amazon S3 bucket or HTTP server from which CloudFront gets the files that it distributes. You can specify any combination of up to 25 Amazon S3 buckets and/or HTTP servers as your origins.
- Whether you want the files to be available to everyone or you want to restrict access to selected users.
- Whether you want CloudFront to require users to use HTTPS to access your content.
- Whether you want CloudFront to forward cookies and/or query strings to your origin.
- Whether you want CloudFront to prevent users in selected countries from accessing your content.
-
Whether you want CloudFront to create access logs.
From the distribution, CloudFront determines the origin server that applies to the requested file type and forwards the request to that server.
- The origin servers then send the files back to the CloudFront edge location.
-
As soon as the first byte arrives from the origin, CloudFront begins to forward the files to the user. CloudFront also adds the files to the cache in the edge location for the next time someone requests those files.

Figure 1 : How CloudFront delivers content
The success of CloudFront relies on the successful delivery of content to users. If errors in request processing go undetected, it can cause content to not be delivered to the intended audience. This is bound to adversely impact user confidence in CloudFront! To avoid this, administrators should be able to promptly detect errors in request processing, rapidly investigate the reason for the errors, and quickly resolve it. This is where the AWS CloudFront - Content Delivery Network test helps.
This test auto-discovers the distributions configured on CloudFront and tracks the requests to and responses of origin servers specified in each distribution. In the process, the test promptly captures HTTP error responses from origin servers, and instantly notifies administrators of the errors. This way, the test pinpoints the distribution that is configured with the origin servers emitting the maximum number of error responses. Administrators can then closely scrutinize such a distribution for any misconfiguration.
Target of the test: Amazon Cloud
Agent deploying the test : A remote agent
Outputs of the test : One set of results for each distribution configured on CloudFront
First-level descriptor: AWS Region
Second-level descriptor: DistributionID
| Parameter | Description |
|---|---|
|
Test Period |
How often should the test be executed. |
|
Host |
The host for which the test is to be configured. |
|
Access Type |
eG Enterprise monitors the AWS cloud using AWS API. By default, the eG agent accesses the AWS API using a valid AWS account ID, which is assigned a special role that is specifically created for monitoring purposes. Accordingly, the Access Type parameter is set to Role by default. Furthermore, to enable the eG agent to use this default access approach, you will have to configure the eG tests with a valid AWS Account ID to Monitor and the special AWS Role Name you created for monitoring purposes.
Some AWS cloud environments however, may not support the role-based approach Note that the Secret option may not be ideal when monitoring high-security cloud environments. This is because, such environments may issue a security mandate, which would require administrators to change the Access Key and Secret Key, often. Because of the dynamicity of the key-based approach, Amazon recommends the Role-based approach for accessing the AWS API. |
|
AWS Account ID to Monitor |
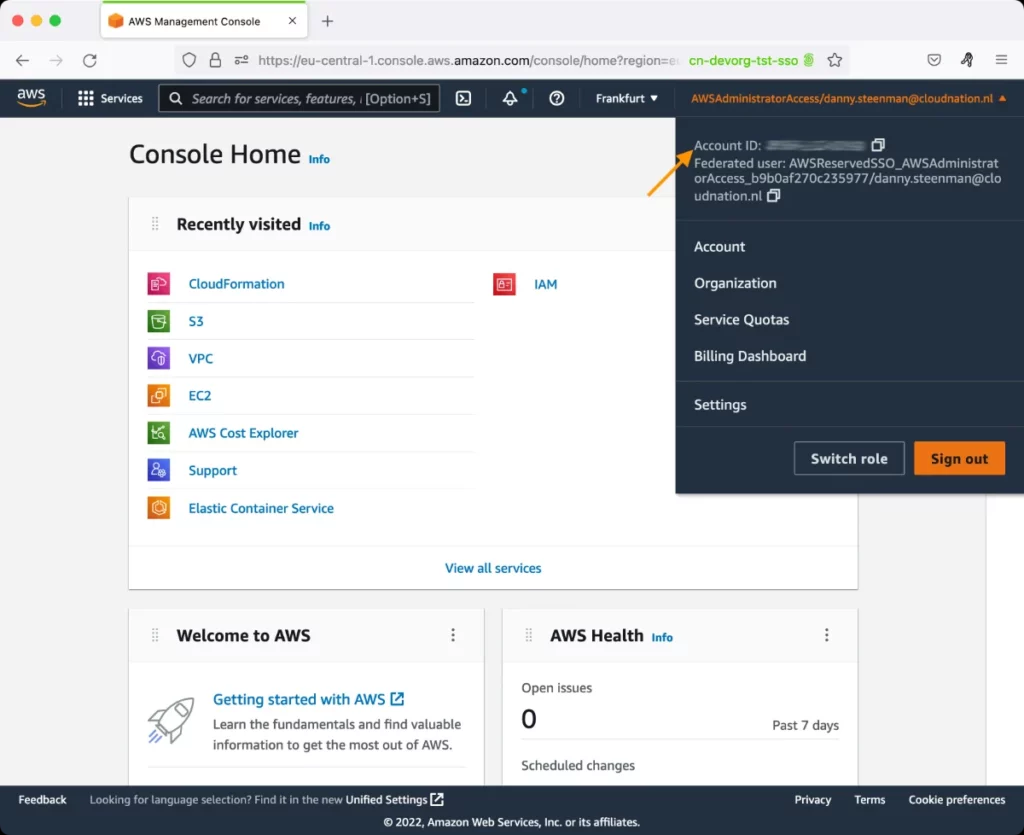
This parameter appears only when the Access Type parameter is set to Role. Specify the AWS Account ID that the eG agent should use for connecting and making requests to the AWS API. To determine your AWS Account ID, follow the steps below:
|
|
AWS Role Name |
This parameter appears when the Access Type parameter is set to Role. Specify the name of the role that you have specifically created on the AWS cloud for monitoring purposes. The eG agent uses this role and the configured Account ID to connect to the AWS Cloud and pull the required metrics. To know how to create such a role, refer to Creating a New Role. |
|
AWS Access Key, AWS Secret Key, Confirm AWS Access Key, Confirm AWS Secret Key |
These parameters appear only when the Access Type parameter is set to Secret.To monitor an Amazon cloud instance using the Secret approach, the eG agent has to be configured with the access key and secret key of a user with a valid AWS account. For this purpose, we recommend that you create a special user on the AWS cloud, obtain the access and secret keys of this user, and configure this test with these keys. The procedure for this has been detailed in the Obtaining an Access key and Secret key topic. Make sure you reconfirm the access and secret keys you provide here by retyping it in the corresponding Confirm text boxes. |
|
Proxy Host and Proxy Port |
In some environments, all communication with the AWS cloud and its regions could be routed through a proxy server. In such environments, you should make sure that the eG agent connects to the cloud via the proxy server and collects metrics. To enable metrics collection via a proxy, specify the IP address of the proxy server and the port at which the server listens against the Proxy Host and Proxy Port parameters. By default, these parameters are set to none , indicating that the eG agent is not configured to communicate via a proxy, by default. |
|
Proxy User Name, Proxy Password, and Confirm Password |
If the proxy server requires authentication, then, specify a valid proxy user name and password in the Proxy User Name and Proxy Password parameters, respectively. Then, confirm the password by retyping it in the Confirm Password text box. By default, these parameters are set to none, indicating that the proxy sever does not require authentication by default. |
|
Proxy Domain and Proxy Workstation |
If a Windows NTLM proxy is to be configured for use, then additionally, you will have to configure the Windows domain name and the Windows workstation name required for the same against the Proxy Domain and Proxy Workstation parameters. If the environment does not support a Windows NTLM proxy, set these parameters to none. |
|
Default Connection Region |
By default, this test connects to the endpoint URL of the us-east-1 region to collect the required metrics. If the default us-east-1 region is not enabled in the target environment, then, for this test to collect the required metrics, specify the region that is enabled in the target environment. |
|
Detailed Diagnosis |
To make diagnosis more efficient and accurate, the eG Enterprise embeds an optional detailed diagnostic capability. With this capability, the eG agents can be configured to run detailed, more elaborate tests as and when specific problems are detected. To enable the detailed diagnosis capability of this test for a particular server, choose the On option. To disable the capability, click on the Off option. The option to selectively enable/disable the detailed diagnosis capability will be available only if the following conditions are fulfilled:
|
| Measurement | Description | Measurement Unit | Interpretation |
|---|---|---|---|
|
Total request |
Indicates the number of HTTP and HTTPS requests (for all HTTP methods ) to the origin servers specified in this distribution. |
Number |
|
|
Data downloaded |
Indicates the amount of data downloaded by viewers for GET, HEAD, and OPTIONS requests to the origin server specified in this distribution. |
KB |
|
|
Data uploaded |
Indicates the amount of data uploaded to the origin servers specified in this distribution, using POST and PUT requests. |
KB |
|
|
Total errors |
Indicates what percentage of requests to the origin servers in this distribution returned HTTP error response codes such as 4xx or 5xx. |
Percent |
Ideally, the value of this measure should be 0. A non-zero value indicates that an HTTP error has occurred. Compare the value of this measure across distributions to know which distribution is configured with origin servers that have returned the maximum HTTP error responses. You may want to take another look at such distributions to find misconfigurations (if any). |
|
HTTP 4xx errors |
Indicates what percentage of requests to the origin servers in this distribution returned HTTP error response code 4xx. |
Percent |
If the value of the Total error measure is abnormally high for a distribution, then you can compare the value of these two measures for that distribution to know what type of HTTP errors were common.
|
|
HTT 5xx errors |
Indicates what percentage of requests to the origin servers in this distribution returned HTTP error response code 5xx. |
Percent |
