AWS CloudTrail Events Test
AWS CloudTrail is an AWS service that helps you enable governance, compliance, and operational and risk auditing of your AWS account. Actions taken by a user, role, or an AWS service are recorded as events in CloudTrail. Events include actions taken in the AWS Management Console, AWS Command Line Interface, and AWS SDKs and APIs.
Administrators can also configure event filters for events that are collected within a CloudTrail trail. This helps AWS customers save time and money by creating trails that contain a subset of overall API operations and account activity. To know which event filters have been created within which CloudTrail, use the AWS CloudTrail Events test!
This test automatically discovers the CloudTrail trails and event filters within each trail. For every event filter, the test reports the total count of events and count of error events captured by that filter. In the process, the test promptly alerts administrators when an error event is captured. Detailed diagnostics provided by this test reveals the complete details of events, thus enabling quick and easy event analysis and troubleshooting.
Target of the test: Amazon Cloud
Agent deploying the test : A remote agent
Outputs of the test : One set of results for each event type in every event filter
First-level descriptor: AWS Region
Second-level descriptor: CloudTrail trail
Third-level descriptor: Event filter
| Parameter | Description |
|---|---|
|
Test Period |
How often should the test be executed. |
|
Host |
The host for which the test is to be configured. |
|
Access Type |
eG Enterprise monitors the AWS cloud using AWS API. By default, the eG agent accesses the AWS API using a valid AWS account ID, which is assigned a special role that is specifically created for monitoring purposes. Accordingly, the Access Type parameter is set to Role by default. Furthermore, to enable the eG agent to use this default access approach, you will have to configure the eG tests with a valid AWS Account ID to Monitor and the special AWS Role Name you created for monitoring purposes.
Some AWS cloud environments however, may not support the role-based approach Note that the Secret option may not be ideal when monitoring high-security cloud environments. This is because, such environments may issue a security mandate, which would require administrators to change the Access Key and Secret Key, often. Because of the dynamicity of the key-based approach, Amazon recommends the Role-based approach for accessing the AWS API. |
|
AWS Account ID to Monitor |
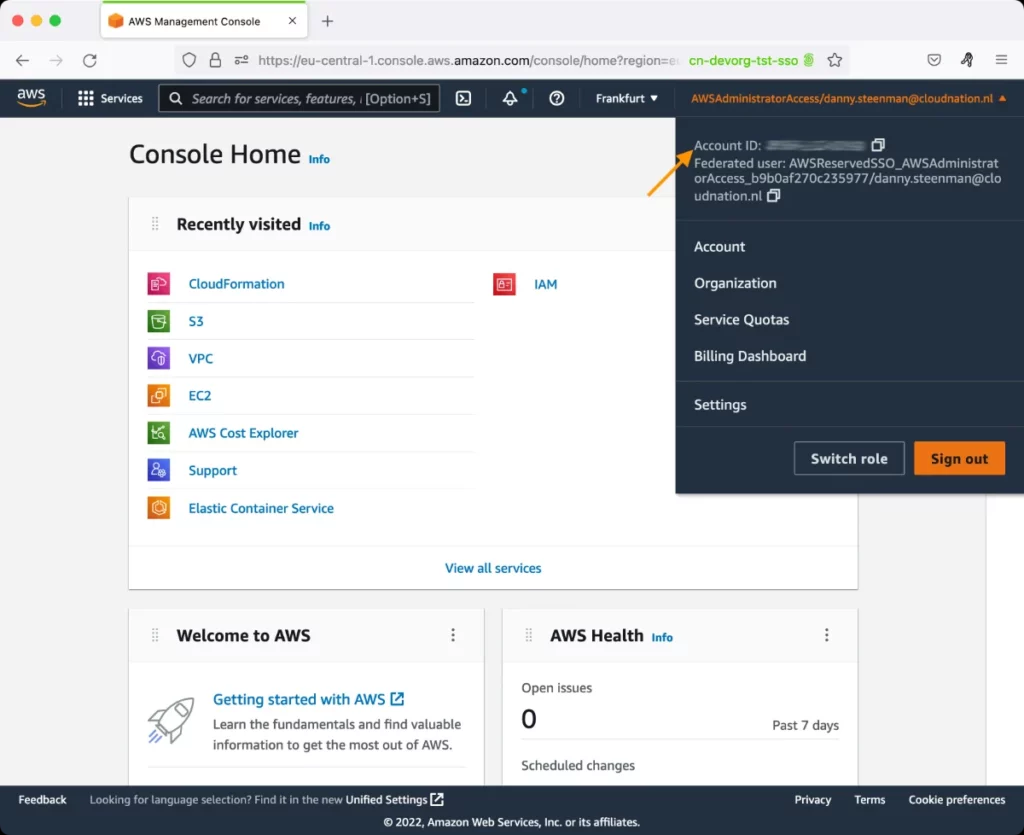
This parameter appears only when the Access Type parameter is set to Role. Specify the AWS Account ID that the eG agent should use for connecting and making requests to the AWS API. To determine your AWS Account ID, follow the steps below:
|
|
AWS Role Name |
This parameter appears when the Access Type parameter is set to Role. Specify the name of the role that you have specifically created on the AWS cloud for monitoring purposes. The eG agent uses this role and the configured Account ID to connect to the AWS Cloud and pull the required metrics. To know how to create such a role, refer to Creating a New Role. |
|
AWS Access Key, AWS Secret Key, Confirm AWS Access Key, Confirm AWS Secret Key |
These parameters appear only when the Access Type parameter is set to Secret.To monitor an Amazon cloud instance using the Secret approach, the eG agent has to be configured with the access key and secret key of a user with a valid AWS account. For this purpose, we recommend that you create a special user on the AWS cloud, obtain the access and secret keys of this user, and configure this test with these keys. The procedure for this has been detailed in the Obtaining an Access key and Secret key topic. Make sure you reconfirm the access and secret keys you provide here by retyping it in the corresponding Confirm text boxes. |
|
Proxy Host and Proxy Port |
In some environments, all communication with the AWS cloud and its regions could be routed through a proxy server. In such environments, you should make sure that the eG agent connects to the cloud via the proxy server and collects metrics. To enable metrics collection via a proxy, specify the IP address of the proxy server and the port at which the server listens against the Proxy Host and Proxy Port parameters. By default, these parameters are set to none , indicating that the eG agent is not configured to communicate via a proxy, by default. |
|
Proxy User Name, Proxy Password, and Confirm Password |
If the proxy server requires authentication, then, specify a valid proxy user name and password in the Proxy User Name and Proxy Password parameters, respectively. Then, confirm the password by retyping it in the Confirm Password text box. By default, these parameters are set to none, indicating that the proxy sever does not require authentication by default. |
|
Proxy Domain and Proxy Workstation |
If a Windows NTLM proxy is to be configured for use, then additionally, you will have to configure the Windows domain name and the Windows workstation name required for the same against the Proxy Domain and Proxy Workstation parameters. If the environment does not support a Windows NTLM proxy, set these parameters to none. |
|
Exclude Region |
Here, you can provide a comma-separated list of region names or patterns of region names that you do not want to monitor. For instance, to exclude regions with names that contain 'east' and 'west' from monitoring, your specification should be: *east*,*west* |
|
Show All Events |
By default, this flag is set to Yes. This implies that by default, this test will also report metrics for an additional All descriptor. Typically, the measures reported by the All descriptor will be the aggregate of the measures reported by all the other descriptors of this test - i.e., every measure reported by the All descriptor will return the sum of the values that all configured events have registered for that measure. This enables administrators to easily assess the overall performance of events configured for monitoring on a Cloud Trail. |
|
Show All Only |
Set this flag to Yes, if you wish to view only the consolidated metrics of all the events of this test. In this case therefore, only the All descriptor will be listed for this test. By default, this flag is set to No. |
|
Show Information DD |
In large AWS infrastructures, tens of thousands of CloudTrail events will be generated, even during normal operations. Naturally, the detailed diagnosis of such events will also occupy a considerable amount of database space; with time, this space consumption will grow. To minimize the strain on the eG database, by default, the detailed diagnosis capability is turned off for the Total events measure alone. Accordingly, the Show Information DD flag is set to No by default. If you want to view detailed metrics for the Total events measure, then set this flag to Yes. |
|
Default Connection Region |
By default, this test connects to the endpoint URL of the us-east-1 region to collect the required metrics. If the default us-east-1 region is not enabled in the target environment, then, for this test to collect the required metrics, specify the region that is enabled in the target environment. |
|
Detailed Diagnosis |
To make diagnosis more efficient and accurate, the eG Enterprise embeds an optional detailed diagnostic capability. With this capability, the eG agents can be configured to run detailed, more elaborate tests as and when specific problems are detected. To enable the detailed diagnosis capability of this test for a particular server, choose the On option. To disable the capability, click on the Off option. The option to selectively enable/disable the detailed diagnosis capability will be available only if the following conditions are fulfilled:
|
|
Measurement |
Description |
Measurement Unit |
Interpretation |
|---|---|---|---|
|
Total events |
Indicates the total number of events currently captured by this event filter. For the All descriptor, this measure will report the total number of events captured by this CloudTrail across all its event filters. |
Number |
If the Show Information DD flag is set to Yes, then you can use the detailed diagnosis of this measure to know the complete details of the events captured by a particular event filter. report Event Name, Event Type, Event Source, Event Time, Source IP Address, Account ID, Region Name, User Name, User Type, User Access key and User Agent. |
|
Error events |
Indicates the number of error events currently captured by this event filter. For the All descriptor, this measure will report the total number of error events captured by this CloudTrail across all its event filters. |
Number |
Ideally, the value of this measure should be 0. A non-zero value indicates that an error event has occurred. In such a situation, you can use the detailed diagnosis of this measure to know the details of the error. |
The detailed diagnosis of the Total events measure reveals the name, type, and source of the events, the time at which the event occurred, the name of the user, the user access key, and user agent.
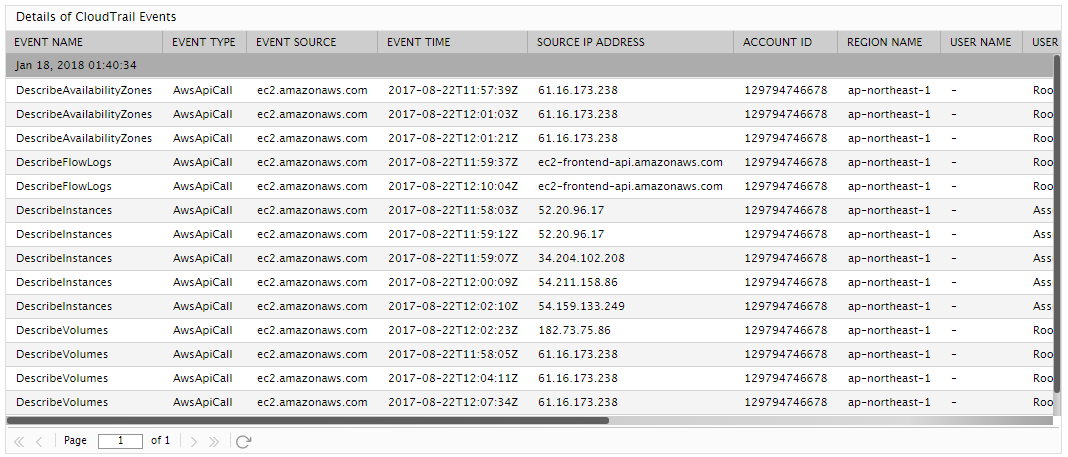
Figure 2 : Detailed diagnosis of the Total events measure