AWS Aggregated Resource Usage Test
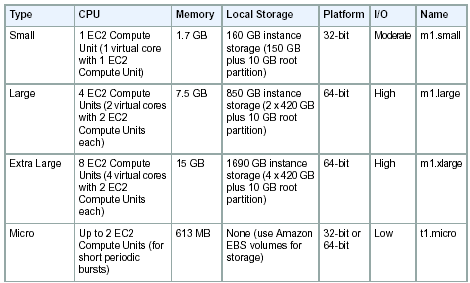
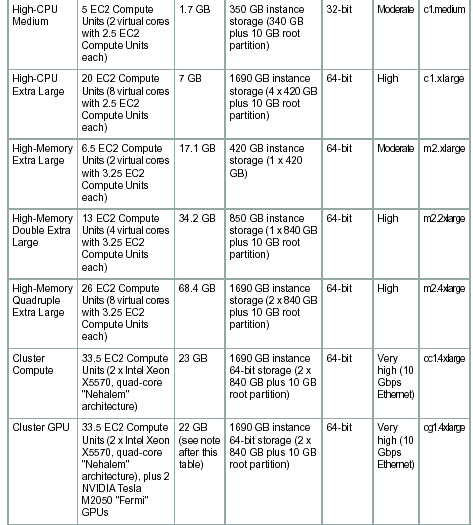
When users launch an instance using the AWS management console, they need to specify the instance type. An instance type is a specification that defines the memory, CPU, storage capacity, and hourly cost for an instance. Some instance types are designed for standard applications, whereas others are designed for CPU-intensive applications, or memory-intensive applications, etc. The different instance types offered by the AWS cloud are as follows:


By closely monitoring the CPU usage and the network and disk I/O of each instance type, and comparing these metrics across instance types, you can quickly isolate resource-intensive types. Once again, the test will report metrics for only those types of instances that were launched by the AWS user account configured for the test.
Target of the test: Amazon Cloud
Agent deploying the test: A remote agent
Output of the test: One set of results for each type of instance launched by the configured AWS user account
| Parameter | Description |
|---|---|
|
Test Period |
How often should the test be executed. |
|
Host |
The host for which the test is to be configured. |
|
Access Type |
eG Enterprise monitors the AWS cloud using AWS API. By default, the eG agent accesses the AWS API using a valid AWS account ID, which is assigned a special role that is specifically created for monitoring purposes. Accordingly, the Access Type parameter is set to Role by default. Furthermore, to enable the eG agent to use this default access approach, you will have to configure the eG tests with a valid AWS Account ID to Monitor and the special AWS Role Name you created for monitoring purposes.
Some AWS cloud environments however, may not support the role-based approach Note that the Secret option may not be ideal when monitoring high-security cloud environments. This is because, such environments may issue a security mandate, which would require administrators to change the Access Key and Secret Key, often. Because of the dynamicity of the key-based approach, Amazon recommends the Role-based approach for accessing the AWS API. |
|
AWS Account ID to Monitor |
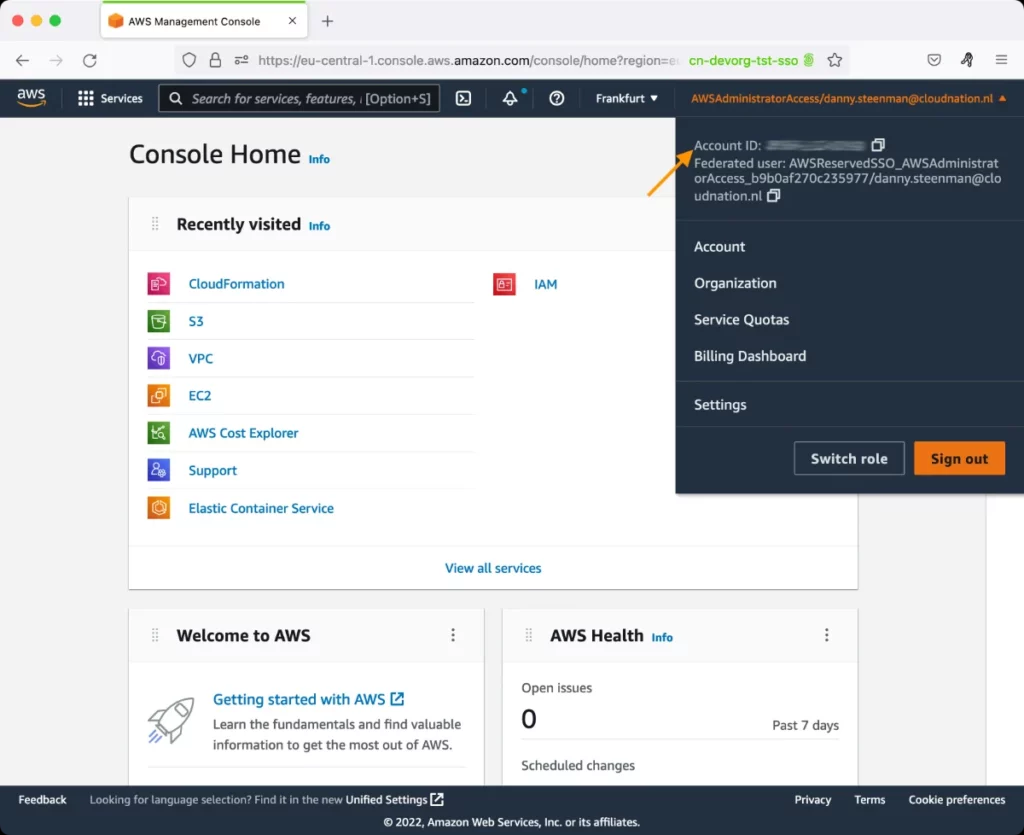
This parameter appears only when the Access Type parameter is set to Role. Specify the AWS Account ID that the eG agent should use for connecting and making requests to the AWS API. To determine your AWS Account ID, follow the steps below:
|
|
AWS Role Name |
This parameter appears when the Access Type parameter is set to Role. Specify the name of the role that you have specifically created on the AWS cloud for monitoring purposes. The eG agent uses this role and the configured Account ID to connect to the AWS Cloud and pull the required metrics. To know how to create such a role, refer to Creating a New Role. |
|
AWS Access Key, AWS Secret Key, Confirm AWS Access Key, Confirm AWS Secret Key |
These parameters appear only when the Access Type parameter is set to Secret.To monitor an Amazon cloud instance using the Secret approach, the eG agent has to be configured with the access key and secret key of a user with a valid AWS account. For this purpose, we recommend that you create a special user on the AWS cloud, obtain the access and secret keys of this user, and configure this test with these keys. The procedure for this has been detailed in the Obtaining an Access key and Secret key topic. Make sure you reconfirm the access and secret keys you provide here by retyping it in the corresponding Confirm text boxes. |
|
Proxy Host and Proxy Port |
In some environments, all communication with the AWS cloud and its regions could be routed through a proxy server. In such environments, you should make sure that the eG agent connects to the cloud via the proxy server and collects metrics. To enable metrics collection via a proxy, specify the IP address of the proxy server and the port at which the server listens against the Proxy Host and Proxy Port parameters. By default, these parameters are set to none , indicating that the eG agent is not configured to communicate via a proxy, by default. |
|
Proxy User Name, Proxy Password, and Confirm Password |
If the proxy server requires authentication, then, specify a valid proxy user name and password in the proxy user name and proxy password parameters, respectively. Then, confirm the password by retyping it in the CONFIRM PASSWORD text box. By default, these parameters are set to none, indicating that the proxy sever does not require authentication by default. |
|
Proxy Domain and Proxy Workstation |
If a Windows NTLM proxy is to be configured for use, then additionally, you will have to configure the Windows domain name and the Windows workstation name required for the same against the proxy domain and proxy workstation parameters. If the environment does not support a Windows NTLM proxy, set these parameters to none. |
|
Exclude Region |
Here, you can provide a comma-separated list of region names or patterns of region names that you do not want to monitor. For instance, to exclude regions with names that contain 'east' and 'west' from monitoring, your specification should be: *east*,*west* |
|
Default Connection Region |
By default, this test connects to the endpoint URL of the us-east-1 region to collect the required metrics. If the default us-east-1 region is not enabled in the target environment, then, for this test to collect the required metrics, specify the region that is enabled in the target environment. |
|
Cloudwatch Enabled |
This parameter only applies to the AWS - Aggregated Resource Usage test. This test reports critical metrics pertaining to the resource usage of the server instances launched in the cloud. If you want this test to report resource usage metrics very frequently - say, once every minute or lesser - you will have to configure the tests to use the AWS CloudWatchservice. This is a paidweb service that enables you to monitor, manage, and publish various metrics, as well as configure alarm actions based on data from metrics. To enable is test to use this service, set the CloudWatch Enabled flag to Yes. On the other hand, to report resource usage metrics less frequently - say, once in 5 minutes or more - this test does not require the AWS CloudWatchservice; in this case therefore, set the cloudwatch enabled flag to No. Note that for enabling CloudWatch, you will have to pay CloudWatch fees. For the fee details, refer to the AWS web site. |
|
Exclude Instance |
This parameter applies only to AWS- Instance Connectivity, AWS- Instance Resources , and AWS- Instance Uptime tests. In the Exclude Instance text box, provide a comma-separated list of instance names or instance name patterns that you do not wish to monitor. For example: i-b0c3e*,*7dbe56d. By default, this parameter is set to none. |
|
Measurement |
Description |
Measurement Unit |
Interpretation |
|---|---|---|---|
|
CPU utilization: |
Indicates the percentage of allocated CPU consumed by all instances of this type. |
Percent |
A high value for this measure indicates that one/more instances of a type are utilizing CPU excessively - this could be because of one/more resource-intensive processes executing on the instances. Compare the value of this measure across types to identify the types of instances that are CPU-intensive. |
|
Incoming network traffic: |
Indicates the rate of incoming network traffic i.e., the rate at which the bytes are received by all the network interfaces connected to all the instances of this instance type. |
KB/Sec |
Compare the values of these measures across instance types to quickly identify the types of instances that are utilizing the network bandwidth excessively. |
|
Outgoing network traffic: |
Indicates the volume of outgoing network traffic i.e., the rate at which the bytes are transferred from all the network interfaces connected to all the instances of a particular instance type. |
KB/Sec |
|
|
Disk reads: |
Indicates the rate at which data is read from the disks of all instances of this type. |
KB/Sec |
These measures are good indicators of the level of disk I/O activity on an instance type. By comparing the values of these measures across types, you can accurately determine the type of instances that is performing I/O-intensive operations. |
|
Disk writes: |
Indicates the rate at which data is written to the disks of all instances of this type. |
KB/Sec |
|
|
Disk read operations: |
Indicates the rate at which disk read operations were performed on the disks of all instances of this type. |
Operations/Sec |
These measures are good indicators of the level of disk I/O activity on an instance type. By comparing the values of these measures across types, you can accurately determine the type of instances that is performing I/O-intensive operations. |
|
Disk write operations: |
Indicates the rate at which disk write operations were performed on the disks of all instances of this type. |
Operations/Sec |
