AWS Elastic Beanstalk Test
AWS Elastic Beanstalk is an easy-to-use service for deploying and scaling web applications and services.
You can simply upload your code and Elastic Beanstalk automatically handles the deployment, from capacity provisioning, load balancing, auto-scaling to application health monitoring. At the same time, you retain full control over the AWS resources powering your application and can access the underlying resources at any time.
Elastic Beanstalk supports applications developed in Java, PHP, .NET, Node.js, Python, and Ruby, as well as different container types for each language. A container defines the infrastructure and software stack to be used for a given environment. When you deploy your application, Elastic Beanstalk provisions one or more AWS resources, such as Amazon instances. The software stack that runs on your Amazon instances depends on the container type. For example, Elastic Beanstalk supports two container types for Node.js: a 32-bit Amazon Linux image and a 64-bit Amazon Linux image. Each runs a software stack tailored to hosting a Node.js application.
To use Elastic Beanstalk, you create an application, upload an application version in the form of an application source bundle (for example, a Java .war file) to Elastic Beanstalk, and then provide some information about the application. Elastic Beanstalk automatically launches an environment and creates and configures the AWS resources needed to run your code. After your environment is launched, you can then manage your environment and deploy new application versions.
The stability of an application deployed using Elastic Beanstalk relies on the overall health and performance of the underlying environment and the instances in the environment. Unhealthy and resource-starved instances and environments, and those experiencing processing errors/bottlenecks consistently, can adversely impact application performance and impair user productivity. If this is to be averted, then administrators should periodically check on the health of the environments configured for application deployment and instances that underlie applications, promptly detect abnormalities, and rapidly initiate measures to mitigate them. This is where the AWS Elastic Beanstalk test helps!
By default, this test automatically discovers the instances that underlie applications and measures the following for each instance:
- Overall health;
- Responsiveness to requests;
- Resource usage;
-
HTTP errors;
In the process, the test leads administrators to unhealthy instances.
Optionally, you can configure the test to report metrics for each environment, instead of instance. This environment-level insight enables administrators to identify the precise environments that have been affected by the unhealthy instances.
Target of the test: Amazon Cloud
Agent deploying the test : A remote agent
Outputs of the test : One set of results for each instance / environment
First-level descriptor: AWS Region
Second-level descriptor: Instance ID / Environment name, depending upon the option chosen from the Beanstalk Filter Name parameter of this test
| Parameter | Description |
|---|---|
|
Test Period |
How often should the test be executed. |
|
Host |
The host for which the test is to be configured. |
|
Access Type |
eG Enterprise monitors the AWS cloud using AWS API. By default, the eG agent accesses the AWS API using a valid AWS account ID, which is assigned a special role that is specifically created for monitoring purposes. Accordingly, the Access Type parameter is set to Role by default. Furthermore, to enable the eG agent to use this default access approach, you will have to configure the eG tests with a valid AWS Account ID to Monitor and the special AWS Role Name you created for monitoring purposes.
Some AWS cloud environments however, may not support the role-based approach Note that the Secret option may not be ideal when monitoring high-security cloud environments. This is because, such environments may issue a security mandate, which would require administrators to change the Access Key and Secret Key, often. Because of the dynamicity of the key-based approach, Amazon recommends the Role-based approach for accessing the AWS API. |
|
AWS Account ID to Monitor |
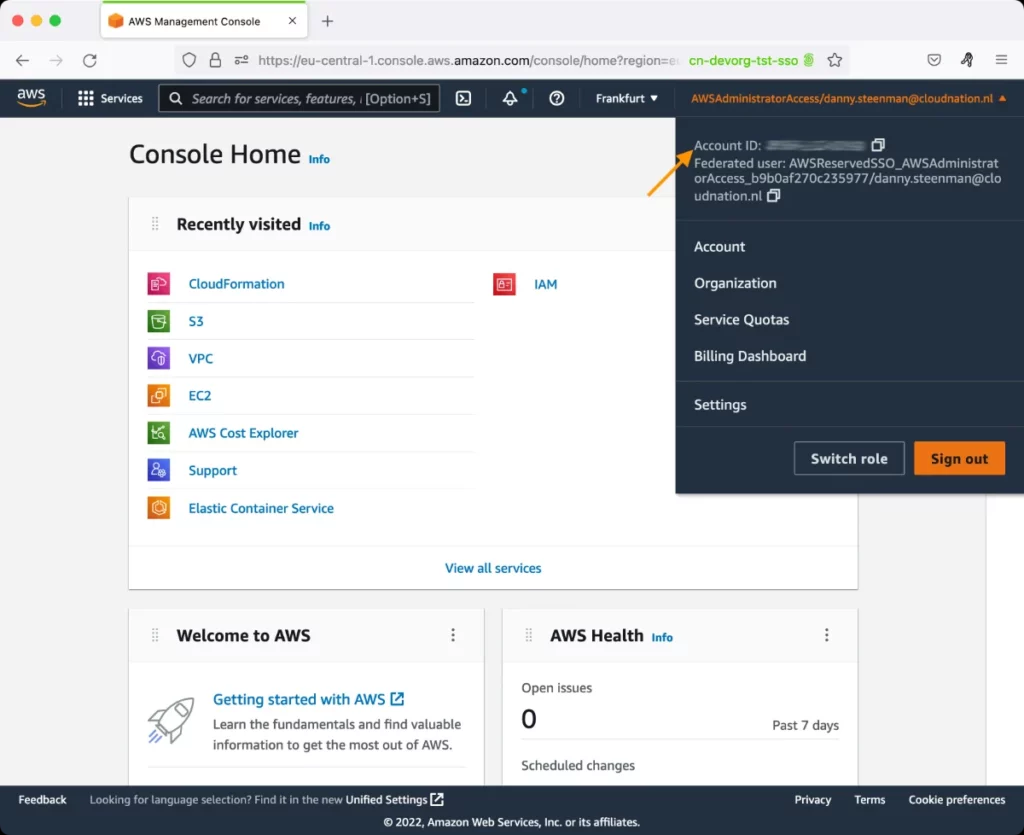
This parameter appears only when the Access Type parameter is set to Role. Specify the AWS Account ID that the eG agent should use for connecting and making requests to the AWS API. To determine your AWS Account ID, follow the steps below:
|
|
AWS Role Name |
This parameter appears when the Access Type parameter is set to Role. Specify the name of the role that you have specifically created on the AWS cloud for monitoring purposes. The eG agent uses this role and the configured Account ID to connect to the AWS Cloud and pull the required metrics. To know how to create such a role, refer to Creating a New Role. |
|
AWS Access Key, AWS Secret Key, Confirm AWS Access Key, Confirm AWS Secret Key |
These parameters appear only when the Access Type parameter is set to Secret.To monitor an Amazon cloud instance using the Secret approach, the eG agent has to be configured with the access key and secret key of a user with a valid AWS account. For this purpose, we recommend that you create a special user on the AWS cloud, obtain the access and secret keys of this user, and configure this test with these keys. The procedure for this has been detailed in the Obtaining an Access key and Secret key topic. Make sure you reconfirm the access and secret keys you provide here by retyping it in the corresponding Confirm text boxes. |
|
Proxy Host and Proxy Port |
In some environments, all communication with the AWS cloud and its regions could be routed through a proxy server. In such environments, you should make sure that the eG agent connects to the cloud via the proxy server and collects metrics. To enable metrics collection via a proxy, specify the IP address of the proxy server and the port at which the server listens against the Proxy Host and Proxy Port parameters. By default, these parameters are set to none , indicating that the eG agent is not configured to communicate via a proxy, by default. |
|
Proxy User Name, Proxy Password, and Confirm Password |
If the proxy server requires authentication, then, specify a valid proxy user name and password in the Proxy User Name and Proxy Password parameters, respectively. Then, confirm the password by retyping it in the Confirm Password text box. By default, these parameters are set to none, indicating that the proxy sever does not require authentication by default. |
|
Proxy Domain and Proxy Workstation |
If a Windows NTLM proxy is to be configured for use, then additionally, you will have to configure the Windows domain name and the Windows workstation name required for the same against the Proxy Domain and Proxy Workstation parameters. If the environment does not support a Windows NTLM proxy, set these parameters to none. |
|
Exclude Region |
Here, you can provide a comma-separated list of region names or patterns of region names that you do not want to monitor. For instance, to exclude regions with names that contain 'east' and 'west' from monitoring, your specification should be: *east*,*west* |
|
Default Connection Region |
By default, this test connects to the endpoint URL of the us-east-1 region to collect the required metrics. If the default us-east-1 region is not enabled in the target environment, then, for this test to collect the required metrics, specify the region that is enabled in the target environment. |
|
Beanstalk Filter Name |
By default, this parameter is set to InstanceID. This means that by default, this test will report metrics for each instance. If required, you can override this default setting by setting the Beanstalk Filter Name parameter to EnvironmentName. In this case, this test will report metrics for every application environment. An environment is a version that is deployed onto AWS resources. Each environment runs only a single application version at a time, however you can run the same version or different versions in many environments at the same time. When you create an environment, Elastic Beanstalk provisions the resources needed to run the application version you specified. |
| Measurement | Description | Measurement Unit | Interpretation | ||||||||||||||||||||||||||||||||
|---|---|---|---|---|---|---|---|---|---|---|---|---|---|---|---|---|---|---|---|---|---|---|---|---|---|---|---|---|---|---|---|---|---|---|---|
|
Completed requests |
By default, this measure represents the number of requests completed by this instance. If the Beanstalk Filter Name is set to EnvironmentName, then this measure represents the number of requests that were completed by this environment. |
Number |
|
||||||||||||||||||||||||||||||||
|
Completed requests with 2XX status code |
By default, this measure represents the number of requests to this instance that resulted in HTTP 2xx response codes. If the Beanstalk Filter Name is set to EnvironmentName, then this measure represents the number of requests to this environment that resulted in HTTP 2xx response codes. |
Number |
This class of status codes indicates the action requested by the client was received, understood and accepted. Ideally therefore, the value of this measure should be high.
|
||||||||||||||||||||||||||||||||
|
Completed requests with 3XX status code |
By default, this measure represents the number of requests to this instance that resulted in HTTP 3xx response codes. If the Beanstalk Filter Name is set to EnvironmentName, then this measure represents the number of requests to this environment that resulted in HTTP 3xx response codes. |
Number |
This class of status code indicates the client must take additional action to complete the request. Many of these status codes are used in URL redirection. |
||||||||||||||||||||||||||||||||
|
Completed requests with 4XX status code |
By default, this measure represents the number of requests to this instance that resulted in HTTP 4xx response codes. If the Beanstalk Filter Name is set to EnvironmentName, then this measure represents the number of requests to this environment that resulted in HTTP 4xx response codes. |
Number |
This class of status code is intended for situations in which the error seems to have been caused by the client. A non-zero value is hence desired for this measure. |
||||||||||||||||||||||||||||||||
|
Completed requests with 5XX status code |
By default, this measure represents the number of requests to this instance that resulted in HTTP 5xx response codes. If the Beanstalk Filter Name is set to EnvironmentName, then this measure represents the number of requests to this environment that resulted in HTTP 5xx response codes. |
Number |
Response status codes beginning with the digit "5" indicate cases in which the server is aware that it has encountered an error or is otherwise incapable of performing the request. A non-zero value is hence desired for this measure.
|
||||||||||||||||||||||||||||||||
|
Time to complete 10 percent of requests |
By default, this measure represents the average time taken by this instance to complete 10 percent of the fastest requests. If the Beanstalk Filter Name is set to EnvironmentName, then this measure represents the average time this environment took to complete 10 percent of the fastest requests. |
Secs |
If the value of this measure is very high, it indicates that the instance/environment has very low processing power. |
||||||||||||||||||||||||||||||||
|
Time to complete 50 percent of requests |
By default, this measure represents the average time taken by this instance to complete 50 percent of the fastest requests. If the Beanstalk Filter Name is set to EnvironmentName, then this measure represents the average time this environment took to complete 50 percent of the fastest requests. |
Secs |
If the value of this measure is very high, it indicates that the instance/environment has very low processing power. |
||||||||||||||||||||||||||||||||
|
Time to complete 75 percent of requests |
By default, this measure represents the average time taken by this instance to complete 75 percent of the fastest requests. If the Beanstalk Filter Name is set to EnvironmentName, then this measure represents the average time this environment took to complete 75 percent of the fastest requests. |
Secs |
If the value of this measure is very high, it indicates that the instance/environment has very low processing power. |
||||||||||||||||||||||||||||||||
|
Time to complete 85 percent of requests |
By default, this measure represents the average time taken by this instance to complete 85 percent of the fastest requests. If the Beanstalk Filter Name is set to EnvironmentName, then this measure represents the average time this environment took to complete 85 percent of the fastest requests. |
Secs |
If the value of this measure is very high, it indicates that the instance/environment has very low processing power. |
||||||||||||||||||||||||||||||||
|
Time to complete 90 percent of requests |
By default, this measure represents the average time taken by this instance to complete 90 percent of the fastest requests. If the Beanstalk Filter Name is set to EnvironmentName, then this measure represents the average time this environment took to complete 90 percent of the fastest requests. |
Secs |
If the value of this measure is very high, it indicates that the instance/environment has very low processing power. |
||||||||||||||||||||||||||||||||
|
Time to complete 95 percent of requests |
By default, this measure represents the average time taken by this instance to complete 95 percent of the fastest requests. If the Beanstalk Filter Name is set to EnvironmentName, then this measure represents the average time this environment took to complete 95 percent of the fastest requests. |
Secs |
If the value of this measure is very high, it indicates that the instance/environment has very low processing power. |
||||||||||||||||||||||||||||||||
|
Time to complete 99 percent of requests |
By default, this measure represents the average time taken by this instance to complete 99 percent of the fastest requests. If the Beanstalk Filter Name is set to EnvironmentName, then this measure represents the average time this environment took to complete 99 percent of the fastest requests. |
Secs |
If the value of this measure is very high, it indicates that the instance/environment has very low processing power. |
||||||||||||||||||||||||||||||||
|
Time to complete X percent of requests |
By default, this measure represents the average time taken by this instance to complete X percent of the fastest requests. If the Beanstalk Filter Name is set to EnvironmentName, then this measure represents the average time this environment took to complete X percent of the fastest requests. |
Secs |
If the value of this measure is very high, it indicates that the instance/environment has very low processing power. |
||||||||||||||||||||||||||||||||
|
Environment status |
Indicates the current health status of this environment |
|
This measure is reported only for an Environment - i.e., only if the 'Beanstalk Filter Name' parameter is set to EnvironmentName. The values that this measure can report and their corresponding numeric values are detailed in the table below:
The table below describes what each of the Measure Values denote for an environment:
Note: By default, this measure reports the Measure Values listed in the table above to indicate the status of an environment. In the graph of this measure however, the same is indicated using the numeric equivalents only. |
||||||||||||||||||||||||||||||||
|
Instances in ok state |
Indicates the number of instances in this environment with OK health status. |
Number |
This measure is reported only for an Environment - i.e., only if the 'Beanstalk Filter Name' parameter is set to EnvironmentName. An instance is said to be in the OK state if the instance is passing health checks and is completing requests normally. |
||||||||||||||||||||||||||||||||
|
Instances in pending state |
Indicates the number of instances in this environment with Pending health status. |
Number |
This measure is reported only for an Environment - i.e., only if the 'Beanstalk Filter Name' parameter is set to EnvironmentName. An instance is said to be in the Pending state if an operation is in progress on thatn instance within the command timeout. |
||||||||||||||||||||||||||||||||
|
Instances in info state |
Indicates the number of instances in this environment with Info health status. |
Number |
This measure is reported only for an Environment - i.e., only if the 'Beanstalk Filter Name' parameter is set to EnvironmentName. An instance is said to be in the Info state if an operation is in progress on that instance. |
||||||||||||||||||||||||||||||||
|
Instances in unknown state |
Indicates the number of instances in this environment with Unknown health status. |
Number |
This measure is reported only for an Environment - i.e., only if the 'Beanstalk Filter Name' parameter is set to EnvironmentName. An instance is said to be in the Unknown state if Elastic Beanstalk and the health agent are reporting an insufficient amount of data on an instance. |
||||||||||||||||||||||||||||||||
|
Instances in nodata state |
Indicates the number of instances in this environment with Warning health status. |
Number |
This measure is reported only for an Environment - i.e., only if the 'Beanstalk Filter Name' parameter is set to EnvironmentName. An instance is said to be in the Nodata state if no health status data has been collected from that instance. |
||||||||||||||||||||||||||||||||
|
Instances in Warning state |
Indicates the number of instances in this environment with Info health status. |
Number |
This measure is reported only for an Environment - i.e., only if the 'Beanstalk Filter Name' parameter is set to EnvironmentName. An instance is said to be in the Warning state if an operation in progress on that instance and is taking a very long time. |
||||||||||||||||||||||||||||||||
|
Instances in degraded state |
Indicates the number of instances in this environment with Degraded health status. |
Number |
This measure is reported only for an Environment - i.e., only if the 'Beanstalk Filter Name' parameter is set to EnvironmentName. An instance is said to be in the Degraded state if the health agent is reporting a high number of request failures or other issues for that instance. Ideally, the value of this measure should be 0. |
||||||||||||||||||||||||||||||||
|
Instances in severe state |
Indicates the number of instances in this environment with Severe health status. |
Number |
This measure is reported only for an Environment - i.e., only if the 'Beanstalk Filter Name' parameter is set to EnvironmentName. An instance is said to be in the Severe state if the health agent is reporting a very high number of request failures or other issues for that instance. Ideally, the value of this measure should be 0. |
||||||||||||||||||||||||||||||||
|
CPU load over last minute |
Indicates the average CPU load of this instance over the last minute. |
Number |
This measure is reported only for an Instance - i.e., only if the 'Beanstalk Filter Name' parameter is set to InstanceID. A high value is indicative of excessive CPU usage by an instance. Compare the value of this measure across instances to know which instance is consuming the maximum CPU. To know where that instance is spending its CPU, take a look at the values reported for the other CPU measures of this test. |
||||||||||||||||||||||||||||||||
|
Instance status |
Indicates the current status of this instance. |
|
This measure is reported only for an instance - i.e., only if the 'Beanstalk Filter Name' parameter is set to InstanceID. The values that this measure can report and their corresponding numeric values are detailed in the table below:
The table below describes what each of the Measure Values denote for an instance:
Note: By default, this measure reports the Measure Values listed in the table above to indicate the status of an instance. In the graph of this measure however, the same is indicated using the numeric equivalents only. |
||||||||||||||||||||||||||||||||
|
Disk space utilization |
Indicates the percentage of disk space utilized by this instance. |
Percent |
This measure is reported only for an instance - i.e., only if the 'Beanstalk Filter Name' parameter is set to InstanceID. A value close to 100% is a cause for concern, as it implies that the instance is running out of disk space. |
||||||||||||||||||||||||||||||||
|
Interrupt request CPU |
Indicates the percentage of time CPU of this instance was in interrupt request state. |
Percent |
This measure is reported only for an instance - i.e., only if the 'Beanstalk Filter Name' parameter is set to InstanceID. In a computer, an interrupt request (or IRQ) is a hardware signal sent to the processor that temporarily stops a running program and allows a special program, an interrupt handler, to run instead. If any instance is using CPU excessively, then compare the value of this measure with that of the User CPU, System CPU, Idle CPU, Waitio CPU, Nice CPU, and Soft interrupt request CPU measures for that instance to know where CPU time has been spent the maximum - in running user processes? system processes? being idle? waiting for I/O? waiting for an interrupt handler? handling a software interrupt? or running nice processes? |
||||||||||||||||||||||||||||||||
|
User CPU |
Indicates the percentage of CPU time that this instance spent running user programs. |
Percent |
This measure is reported only for an instance - i.e., only if the 'Beanstalk Filter Name' parameter is set to InstanceID. If any instance is using CPU excessively, then compare the value of this measure with that of the Interrupt request CPU, System CPU, Idle CPU, Waitio CPU, Nice CPU, and Soft interrupt request CPU measures for that instance to know where CPU time has been spent the maximum - in running user processes? system processes? being idle? waiting for I/O? waiting for an interrupt handler? handling a software interrupt? or running nice processes? |
||||||||||||||||||||||||||||||||
|
System CPU |
Indicates the percentage of CPU time that this instance spent on system-level processing. |
Percent |
This measure is reported only for an instance - i.e., only if the 'Beanstalk Filter Name' parameter is set to InstanceID. If any instance is using CPU excessively, then compare the value of this measure with that of the Interrupt request CPU, User CPU, Idle CPU, Waitio CPU, Nice CPU, and Soft interrupt request CPU measures for that instance to know where CPU time has been spent the maximum - in running user processes? system processes? being idle? waiting for I/O? waiting for an interrupt handler? handling a software interrupt? or running nice processes? |
||||||||||||||||||||||||||||||||
|
Idle CPU |
Indicates the percentage of CPU time that this instance spent without processing any requests - i.e., just being idle. |
Percent |
This measure is reported only for an instance - i.e., only if the 'Beanstalk Filter Name' parameter is set to InstanceID. If any instance is using CPU excessively, then compare the value of this measure with that of the Interrupt request CPU, User CPU, System CPU, Waitio CPU, Nice CPU, and Soft interrupt request CPU measures for that instance to know where CPU time has been spent the maximum - in running user processes? system processes? being idle? waiting for I/O? waiting for an interrupt handler? handling a software interrupt? or running nice processes? |
||||||||||||||||||||||||||||||||
|
Soft interrupt request CPU |
Indicates the percentage of CPU time that this instance spent in the soft interrupt request state. |
Percent |
This measure is reported only for an instance - i.e., only if the 'Beanstalk Filter Name' parameter is set to InstanceID. A software interrupt or soft interrupt is caused either by an exceptional condition in the processor itself, or a special instruction in the instruction set which causes an interrupt when it is executed If any instance is using CPU excessively, then compare the value of this measure with that of the Interrupt request CPU, User CPU, System CPU, Idle CPU, Waitio CPU, and Nice CPU measures for that instance to know where CPU time has been spent the maximum - in running user processes? system processes? being idle? waiting for I/O? waiting for an interrupt handler? handling a software interrupt? or running nice processes? |
||||||||||||||||||||||||||||||||
|
Wait IO CPU |
Indicates the percentage of CPU time that this instance spent waiting for I/O. |
Percent |
This measure is reported only for an instance - i.e., only if the 'Beanstalk Filter Name' parameter is set to InstanceID. If any instance is using CPU excessively, then compare the value of this measure with that of the Interrupt request CPU, User CPU, System CPU, Idle CPU, Nice CPU, and Soft interrupt request measures for that instance to know where CPU time has been spent the maximum - in running user processes? system processes? being idle? waiting for I/O? waiting for an interrupt handler? handling a software interrupt? or running nice processes? |
||||||||||||||||||||||||||||||||
|
Nice CPU |
Indicates the percentage of CPU time that this instance spent in running nice processes. |
Percent |
This measure is reported only for an instance - i.e., only if the 'Beanstalk Filter Name' parameter is set to InstanceID. nice is program that is used to invoke a utility or shell script with a particular priority, thus giving the process more or less CPU time than other processes. If any instance is using CPU excessively, then compare the value of this measure with that of the Interrupt request CPU, User CPU, System CPU, Idle CPU, Waitio CPU, and Software interrupt request measures for that instance to know where CPU time has been spent the maximum - in running user processes? system processes? being idle? waiting for I/O? waiting for an interrupt handler? handling a software interrupt? or running nice processes? |