AWS Elastic Block Store - EBS Test
Amazon Elastic Block Store (Amazon EBS) provides persistent block level storage volumes for use with Amazon instances in the AWS Cloud. An Amazon EBS volume is a durable, block-level storage device that you can attach to a single instance. You can use EBS volumes as primary storage for data that requires frequent updates, such as system drive for an instance or storage for a database application. If such an EBS volume suddenly becomes unavailable or impaired, it is bound to adversely impact the operations of the instance attached to that volume, which in turn will damage the experience of the users of that instance. Administrators need to be promptly alerted to such problem conditions, so that they can instantly initiate remedial action and ensure high instance uptime. Besides volume status, administrators also need to track the I/O load on the EBS volume and continuously measure the ability of the volume to handle that load. This insight will enable administrators to provision the volumes with more or less I/O, so as to optimize I/O processing and maximize volume performance. The AWS Elastic Block Store - EBS test helps administrators in this exercise.
The test periodically checks the health and availability status of each volume used by the instances in every region of the AWS cloud and notifies administrators if any volume is in an abnormal state. Similarly, the test also tracks the I/O load on every volume and measures how well each volume processes the load - overloaded volumes and those that are experiencing processing hiccups are highlighted in the process.
Target of the test: Amazon Cloud
Agent deploying the test: A remote agent
Output of the test: One set of results for each volume in each region of the AWS cloud being monitored
First-level descriptor: AWS region name
Second-level descriptor: EBS volume name
| Parameter | Description |
|---|---|
|
Test Period |
How often should the test be executed. |
|
Host |
The host for which the test is to be configured. |
|
Access Type |
eG Enterprise monitors the AWS cloud using AWS API. By default, the eG agent accesses the AWS API using a valid AWS account ID, which is assigned a special role that is specifically created for monitoring purposes. Accordingly, the Access Type parameter is set to Role by default. Furthermore, to enable the eG agent to use this default access approach, you will have to configure the eG tests with a valid AWS Account ID to Monitor and the special AWS Role Name you created for monitoring purposes.
Some AWS cloud environments however, may not support the role-based approach Note that the Secret option may not be ideal when monitoring high-security cloud environments. This is because, such environments may issue a security mandate, which would require administrators to change the Access Key and Secret Key, often. Because of the dynamicity of the key-based approach, Amazon recommends the Role-based approach for accessing the AWS API. |
|
AWS Account ID to Monitor |
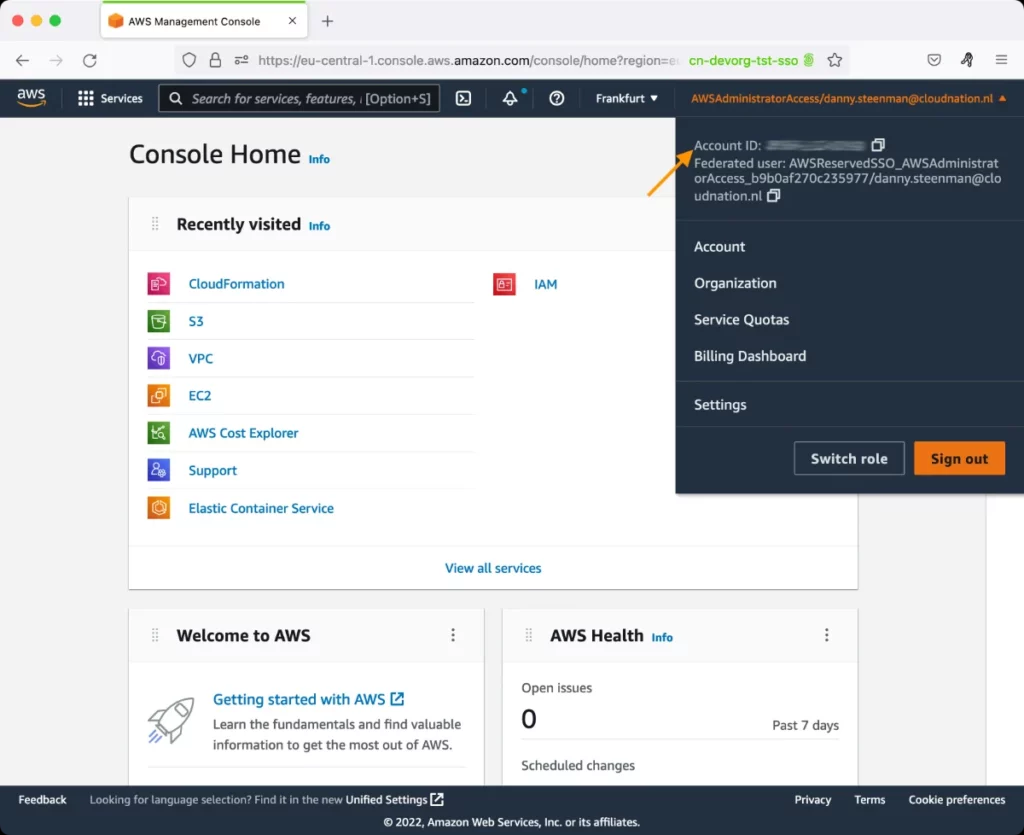
This parameter appears only when the Access Type parameter is set to Role. Specify the AWS Account ID that the eG agent should use for connecting and making requests to the AWS API. To determine your AWS Account ID, follow the steps below:
|
|
AWS Role Name |
This parameter appears when the Access Type parameter is set to Role. Specify the name of the role that you have specifically created on the AWS cloud for monitoring purposes. The eG agent uses this role and the configured Account ID to connect to the AWS Cloud and pull the required metrics. To know how to create such a role, refer to Creating a New Role. |
|
AWS Access Key, AWS Secret Key, Confirm AWS Access Key, Confirm AWS Secret Key |
These parameters appear only when the Access Type parameter is set to Secret.To monitor an Amazon cloud instance using the Secret approach, the eG agent has to be configured with the access key and secret key of a user with a valid AWS account. For this purpose, we recommend that you create a special user on the AWS cloud, obtain the access and secret keys of this user, and configure this test with these keys. The procedure for this has been detailed in the Obtaining an Access key and Secret key topic. Make sure you reconfirm the access and secret keys you provide here by retyping it in the corresponding Confirm text boxes. |
|
Proxy Host and Proxy Port |
In some environments, all communication with the AWS cloud and its regions could be routed through a proxy server. In such environments, you should make sure that the eG agent connects to the cloud via the proxy server and collects metrics. To enable metrics collection via a proxy, specify the IP address of the proxy server and the port at which the server listens against the Proxy Host and Proxy Port parameters. By default, these parameters are set to none , indicating that the eG agent is not configured to communicate via a proxy, by default. |
|
Proxy User Name, Proxy Password, and Confirm Password |
If the proxy server requires authentication, then, specify a valid proxy user name and password in the proxy user name and proxy password parameters, respectively. Then, confirm the password by retyping it in the CONFIRM PASSWORD text box. By default, these parameters are set to none, indicating that the proxy sever does not require authentication by default. |
|
Proxy Domain and Proxy Workstation |
If a Windows NTLM proxy is to be configured for use, then additionally, you will have to configure the Windows domain name and the Windows workstation name required for the same against the proxy domain and proxy workstation parameters. If the environment does not support a Windows NTLM proxy, set these parameters to none. |
|
Exclude Region |
Here, you can provide a comma-separated list of region names or patterns of region names that you do not want to monitor. For instance, to exclude regions with names that contain 'east' and 'west' from monitoring, your specification should be: *east*,*west* |
|
Default Connection Region |
By default, this test connects to the endpoint URL of the us-east-1 region to collect the required metrics. If the default us-east-1 region is not enabled in the target environment, then, for this test to collect the required metrics, specify the region that is enabled in the target environment. |
|
Report By Tag |
This flag controls whether the descriptor displays the Name tag associated with each volume. If this flag is set to Yes, the descriptor displays the configured Name tag for each volume. If this flagis set to No, the descriptor does not display the Name tag and instead shows a “-” against the corresponding volume. |
|
DD Frequency |
Refers to the frequency with which detailed diagnosis measures are to be generated for this test. The default is 1:1. This indicates that, by default, detailed measures will be generated every time this test runs, and also every time the test detects a problem. You can modify this frequency, if you so desire. Also, if you intend to disable the detailed diagnosis capability for this test, you can do so by specifying none against DD frequency. |
|
Detailed Diagnosis |
To make diagnosis more efficient and accurate, the eG Enterprise embeds an optional detailed diagnostic capability. With this capability, the eG agents can be configured to run detailed, more elaborate tests as and when specific problems are detected. To enable the detailed diagnosis capability of this test for a particular server, choose the On option. To disable the capability, click on the Off option. The option to selectively enable/disable the detailed diagnosis capability will be available only if the following conditions are fulfilled:
|
|
Measurement |
Description |
Measurement Unit |
Interpretation |
|||||||||||||||||||||
|---|---|---|---|---|---|---|---|---|---|---|---|---|---|---|---|---|---|---|---|---|---|---|---|---|
|
State |
Indicates the current state of this volume. |
|
The values that this measure can report and their corresponding numeric values are detailed in the table below:
The detailed diagnosis of this measure will reveal when the volume was created and in which availability zone it resides. Note: By default, this measure will report the Measure Values listed in the table above to indicate the current availability state of a volume. In the graph of this measure however, the same will be represented using the numeric equivalents only. If any EBS volume is found to be in an abnormal state, then you can use the detailed diagnosis of this measure to know the volume type, when that volume was created, and in which availability zone the volume resides. |
|||||||||||||||||||||
|
Status
|
Indicates the current health status of this volume |
|
AWS periodically runs volume status checks to enable you to better understand, track, and manage potential inconsistencies in the data on an Amazon EBS volume. Volume status checks are automated tests that run every 5 minutes and return a pass or fail status. The value that this measure reports varies with the status reported by the volume status checks. The table below describes what value this measure reports when , and also lists the numeric values that correspond to the measure values.
Note: By default, this measure will report the Measure Values listed in the table above to indicate the current status of a volume. In the graph of this measure however, the same will be represented using the numeric equivalents only. |
|||||||||||||||||||||
|
Idle time: |
Indicates the percentage of time for which no read or write operations were submitted to this volume. |
Percent |
|
|||||||||||||||||||||
|
Queue length:
|
Indicates the number of read and write operation requests waiting to be completed. |
Number |
A consistent increase in the value of this measure could indicate a I/O processing bottleneck on the volume. |
|||||||||||||||||||||
|
Read operations: |
Indicates the rate at which read operations were performed on this volume. |
Operations/Sec |
Compare the value of this measure across volumes to know which volume is too slow in processing read requests. |
|||||||||||||||||||||
|
Write operations: |
Indicates the rate at which write operations were performed on this volume. |
Operations/Sec |
Compare the value of this measure across volumes to know which volume is too slow in processing write requests. |
|||||||||||||||||||||
|
Reads: |
Indicates the rate at which data was read from this volume. |
KB/Sec |
Compare the value of this measure to identify the volume that is the slowest in responding to read requests. |
|||||||||||||||||||||
|
Writes: |
Indicates the rate at which data was written to this volume. |
KB/Sec |
Compare the value of this measure to identify the volume that is the slowest in responding to write requests. |
|||||||||||||||||||||
|
Total read time:
|
Indicates the total time taken by all completed read operations. |
Secs |
A very high value for this measure could indicate that the volume took too long to service one/more read requests. |
|||||||||||||||||||||
|
Total write time: |
Indicates the total time taken by all completed write operations. |
Secs |
A very high value for this measure could indicate that the volume took too long to service one/more write requests. |
|||||||||||||||||||||
|
Provisioned IOPS (SSD)volume throughput:
|
Indicates the percentage of I/O operations per second (IOPS) delivered of the total IOPS provisioned for this volume. |
Percent |
This measure will be reported for Provisioned IOPS volumes only. Provisioned IOPS (SSD) volumes are designed to meet the needs of I/O-intensive workloads, particularly database workloads, that are sensitive to storage performance and consistency in random access I/O throughput. You specify an IOPS rate when you create the volume, and Amazon EBS delivers within 10 percent of the provisioned IOPS performance 99.9 percent of the time over a given year. A Provisioned IOPS (SSD) volume can range in size from 4 GiB to 16 TiB and you can provision up to 20,000 IOPS per volume. The ratio of IOPS provisioned to the volume size requested can be a maximum of 30; for example, a volume with 3,000 IOPS must be at least 100 GiB. You can stripe multiple volumes together in a RAID configuration for larger size and greater performance. For smaller I/O operations, you may even see an IOPS value that is higher than what you have provisioned - i.e., the value of this measure can be greater than 100%. This could be because the client operating system may be coalescing multiple smaller I/O operations into a smaller number of large chunks. On the other hand, if the value of this measure is consistently lower than the expected IOPS or throughput you have provisioned, then ensure that your bandwidth is not the limiting factor; your instance should be EBS-optimized (or include 10 Gigabit network connectivity) and your instance type EBS dedicated bandwidth should exceed the I/O throughput you intend to drive. Another possible cause for not experiencing the expected IOPS is that you are not driving enough I/O to the EBS volumes.
|
|||||||||||||||||||||
|
Total IOPS for provisioned IOPS volume: |
Indicates the total amount of read and write operations (normalized to 256K capacity units) consumed by this volume in a specified period of time. |
Number |
This measure will be reported for Provisioned IOPS volumes only. I/O operations that are smaller than 256K each count as 1 consumed IOPS. I/O operations that are larger than 256K are counted in 256K capacity units. For example, a 1024K I/O would count as 4 consumed IOPS. |
|||||||||||||||||||||
|
Size: |
Indicates the current size of this volume. |
GB |
For a General Purpose (SSD) Volume, volume size is what dictates the baseline performance level of the volume and how quickly it accumulates I/O credits; larger volumes have higher baseline performance levels and accumulate I/O credits faster. For a Provisioned IOPS (SSD) Volume, the ratio of IOPS provisioned to volume size can be a maximum of 30; for example, a volume with 3,000 IOPS must be at least 100 GiB. Magnetic volumes can range in size from 1 GiB to 1 TiB. |
|||||||||||||||||||||
|
Total IOPS: |
Indicates the total number of I/O operations that were performed on this volume per second. |
Operations/Sec |
IOPS are input/output operations per second. Amazon EBS measures each I/O operation per second (that is 256 KiB or smaller) as one IOPS. I/O operations that are larger than 256 KiB are counted in 256 KiB capacity units. For example, a single 1,024 KiB I/O operation would count as 4 IOPS; however, 1,024 I/O operations at 1 KiB each would count as 1,024 IOPS. When you create a 3,000 IOPS volume, either a 3,000 IOPS Provisioned IOPS (SSD) volume or a 1,000 GiB General Purpose (SSD) volume, and attach it to an EBS-optimized instance that can provide the necessary bandwidth, you can transfer up to 3,000 chunks of data per second (provided that the I/O does not exceed the per volume throughput limit of the volume). If your I/O chunks are very large, then the value of this measure may be lesser than what you provisioned because you are hitting the throughput limit of the volume. For example 1,000 GiB General Purpose (SSD) volume has an IOPS limit of 3,000 and a volume throughput limit of 160 MiB/s. If you are using a 256 KiB I/O size, your volume will reach its throughput limit at 640 IOPS (640 x 256 KiB = 160 MiB). For smaller I/O sizes (such as 16 KiB), this same volume can sustain 3,000 IOPS because the throughput is well below 160 MiB/s. On Provisioned IOPS Volumes, for smaller I/O operations, you may even see that the value of this measure is higher than what you have provisioned. This could be because the client operating system may be coalescing multiple smaller I/O operations into a smaller number of large chunks. On the other hand, if the value of this measure is consistently lower than the expected IOPS or throughput you have provisioned for a Provisioned IOPS volume, then ensure that your bandwidth is not the limiting factor; your instance should be EBS-optimized (or include 10 Gigabit network connectivity) and your instance type EBS dedicated bandwidth should exceed the I/O throughput you intend to drive. Another possible cause for not experiencing the expected IOPS is that you are not driving enough I/O to the EBS volumes. Magnetic volumes deliver approximately 100 IOPS on average, with burst capability of up to hundreds of IOPS. |
|||||||||||||||||||||
|
IOPS limits: |
Indicates the IOPS limit of this volume. |
Operations/Sec |
For Provisioned IOPS volumes, the IOPS limit is specified when creating the volumes. For General Purpose IOPS volumes, the volume size dictates the baseline IOPS limit of that volume and how quickly it accumulates I/O credits. |
|||||||||||||||||||||
|
IOPS utilization:
|
Indicates the percentage of provisioned IOPS or IOPS limit that is being utilized by this volume. |
Percent |
This metric can also help you identify over-utilized volumes, which could be impacting application performance. In these cases, you could improve performance by upgrading to a different volume type or provisioning more IOPS. |
|||||||||||||||||||||
|
Throughput: |
Indicates the rate of reads and writes processed by this volume. |
KB/Second |
A consistent drop in this value could indicate a I/O processing bottleneck on the volume. You may want to closely track the variations to this measure, so that you can proactively identify the volume that may soon reach its throughput limit. The maximum throughput of each volume type is indicated below:
If your I/O chunks are very large, then a volume will reach its throughput limit much before its IOPS limit is reached. If you are not experiencing the throughput you have provisioned, ensure that your bandwidth is not the limiting factor; your instance should be EBS-optimized (or include 10 Gigabit network connectivity) and your instance type EBS dedicated bandwidth should exceed the I/O throughput you intend to drive. |
|||||||||||||||||||||
|
Burst balance |
Indicates the percentage of I/O credits (for gp2) or throughput credits (for st1 and sc1) remaining in the burst bucket for this volume. |
Percent |
This measure is applicable to General Purpose SSD (gp2), Throughput Optimized HDD (st1), and Cold HDD (sc1) volumes only. The performance of gp2 volumes is tied to volume size, which determines the baseline performance level of the volume and how quickly it accumulates I/O credits; larger volumes have higher baseline performance levels and accumulate I/O credits faster. I/O credits represent the available bandwidth that your gp2 volume can use to burst large amounts of I/O when more than the baseline performance is needed. The more credits your volume has for I/O, the more time it can burst beyond its baseline performance level and the better it performs when more performance is needed. Each gp2 volume receives an initial I/O credit balance of 5.4 million I/O credits, which is enough to sustain the maximum burst performance of 3,000 IOPS for 30 minutes. Volumes earn I/O credits at the baseline performance rate of 3 IOPS per GiB of volume size. When your volume uses fewer I/O credits than it earns in a second, unused I/O credits are added to the I/O credit balance. When your volume requires more than the baseline performance I/O level, it draws on I/O credits in the credit balance to burst to the required performance level, up to a maximum of 3,000 IOPS. This means that for a gp2 volume to burst performance levels above its baseline, a high I/O credit balance is necessary. This implies that the value of this measure should ideally be high for a gp2 volume. If your gp2 volume uses all of its I/O credit balance - i.e., if the value of this measure is 0 or very low for a gp2 volume - then the maximum IOPS performance of the volume remains at the baseline IOPS performance level (the rate at which your volume earns credits) and the volume's maximum throughput is reduced to the baseline IOPS multiplied by the maximum I/O size. When I/O demands rise above the baseline performance level of the volume, the volume will be unable to meet with the demand owing to the lack of adequate I/O credits. Like gp2, st1 and sc1 volumes use a burst-bucket model for performance. Volume size determines the baseline throughput of your volume, which is the rate at which the volume accumulates throughput credits. Volume size also determines the burst throughput of your volume, which is the rate at which you can spend credits when they are available. Larger volumes have higher baseline and burst throughput. The more credits your volume has, the longer it can drive I/O at the burst level. For peak performance of st1 and sc1 volumes therefore, the value of this measure should be high ideally. After the bucket is depleted, throughput is limited to the baseline rate of 12 MiB/s per TiB. |
|||||||||||||||||||||
|
Attached instances |
Indicates the number of instances attached to this volume. |
Number |
Use the detailed diagnosis of this measure to know which instances are attached to the volume, and which region each instance belongs to. |
Detailed Diagnosis:
The detailed diagnosis of the State measure of a volume will reveal when the volume was created and in which availability zone it resides.
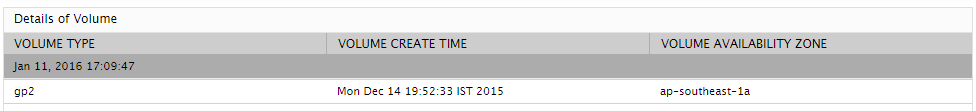
Figure 2 : The detailed diagnosis of the State measure of the AWS Elastic Block Store - EBS Test