AWS VPC Flow Logs by Destinations Test
VPC Flow Logs is a feature that enables you to capture information about the IP traffic going to and from network interfaces in your VPC (Virtual Private Cloud).
Using flow logs, you can easily troubleshoot why specific traffic is not reaching an instance, which in turn can help diagnose overly restrictive security group rules. You can also use flow logs as a security tool to monitor the traffic that is reaching your instance, to profile your network traffic, and to look for abnormal traffic behaviors. A common use of these flow log records is to watch for abnormal and unexpected denied outbound connection requests, which could be an indication of a misconfigured or compromised instance.
To provide administrators with quick and useful insights into network traffic on VPCs , and to enable them to promptly identify and take action against abnormal traffic, the eG agent periodically reads flow logs and reports network traffic metrics. For this, the eG agent runs the following Flow Log tests:
- AWS VPC Flow Logs by Protocols
- AWS VPC Flow Logs by Destinations
- AWS VPC Flow Logs by Sources
The AWS VPC Flow Logs by Destinations test for instance, automatically discovers the network interfaces handling traffic on the VPCs, and reports the following for each discovered interface:
- The destinations to which that interface sent traffic;
- The traffic that was routed to each destination;
In the event of a network congestion on an interface, these destination-wise statistics can help administrators accurately pinpoint which destination is probably contributing to the congestion.
If the detailed diagnostic capability of the test is enabled, then the eG agent will additionally provide deep-dive insights into the traffic by listing the top-10 flows for a destination in terms of the data transferred to it. If the traffic to a destination is abnormally high, then the detailed diagnostics will reveal:
- Has the destination been receiving a large amount of data consistently or is it just a momentary spike in traffic?
- Are transmissions from any particular source significantly higher than the rest? If so, which one?
- How often have network policies/security groups rejected the data sent to this destination?
For the AWS VPC Flow Logs by Destinations test to run, the following pre-requisites should be fulfilled:
- You should first create flow logs. To create a flow log, you specify the resource for which you want to create the flow log (VPC, subnet, or network interface), the type of traffic to capture (accepted traffic, rejected traffic, or all traffic), the name of a log group in CloudWatch Logs to which the flow log will be published, and the ARN of an IAM role that has sufficient permission to publish the flow log to the CloudWatch Logs log group.
- After the flow logs are created, the flow data will be collected and published to the CloudWatch logs log group that was specified during flow log creation. To enable the eG agent to read these logs, you need to make sure that the flow logs are exported to Amazon S3.
Target of the test: Amazon Cloud
Agent deploying the test : A remote agent
Outputs of the test : One set of results for each destination receiving traffic from every interface of a region
First-level descriptor: AWS Region
Second-level descriptor: Interface name
Third-level descriptor: Destination IP address
| Parameter | Description |
|---|---|
|
Test Period |
How often should the test be executed. |
|
Host |
The host for which the test is to be configured. |
|
Access Type |
eG Enterprise monitors the AWS cloud using AWS API. By default, the eG agent accesses the AWS API using a valid AWS account ID, which is assigned a special role that is specifically created for monitoring purposes. Accordingly, the Access Type parameter is set to Role by default. Furthermore, to enable the eG agent to use this default access approach, you will have to configure the eG tests with a valid AWS Account ID to Monitor and the special AWS Role Name you created for monitoring purposes.
Some AWS cloud environments however, may not support the role-based approach Note that the Secret option may not be ideal when monitoring high-security cloud environments. This is because, such environments may issue a security mandate, which would require administrators to change the Access Key and Secret Key, often. Because of the dynamicity of the key-based approach, Amazon recommends the Role-based approach for accessing the AWS API. |
|
AWS Account ID to Monitor |
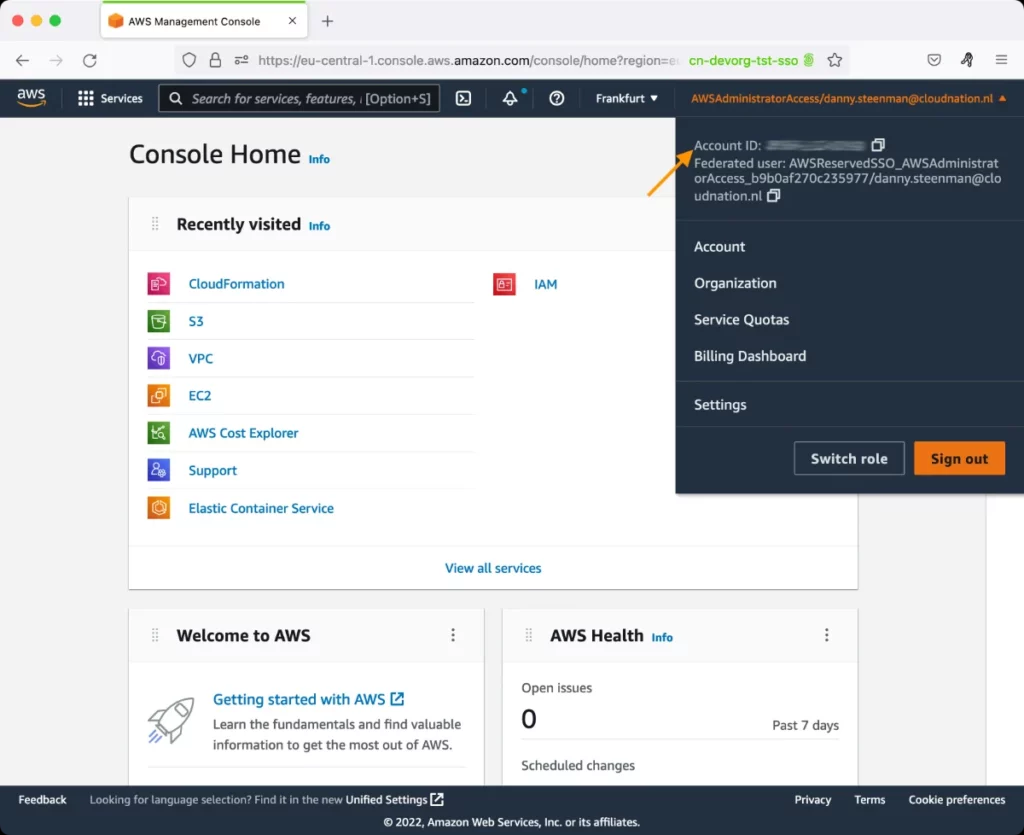
This parameter appears only when the Access Type parameter is set to Role. Specify the AWS Account ID that the eG agent should use for connecting and making requests to the AWS API. To determine your AWS Account ID, follow the steps below:
|
|
AWS Role Name |
This parameter appears when the Access Type parameter is set to Role. Specify the name of the role that you have specifically created on the AWS cloud for monitoring purposes. The eG agent uses this role and the configured Account ID to connect to the AWS Cloud and pull the required metrics. To know how to create such a role, refer to Creating a New Role. |
|
AWS Access Key, AWS Secret Key, Confirm AWS Access Key, Confirm AWS Secret Key |
These parameters appear only when the Access Type parameter is set to Secret.To monitor an Amazon cloud instance using the Secret approach, the eG agent has to be configured with the access key and secret key of a user with a valid AWS account. For this purpose, we recommend that you create a special user on the AWS cloud, obtain the access and secret keys of this user, and configure this test with these keys. The procedure for this has been detailed in the Obtaining an Access key and Secret key topic. Make sure you reconfirm the access and secret keys you provide here by retyping it in the corresponding Confirm text boxes. |
|
Proxy Host and Proxy Port |
In some environments, all communication with the AWS cloud and its regions could be routed through a proxy server. In such environments, you should make sure that the eG agent connects to the cloud via the proxy server and collects metrics. To enable metrics collection via a proxy, specify the IP address of the proxy server and the port at which the server listens against the Proxy Host and Proxy Port parameters. By default, these parameters are set to none , indicating that the eG agent is not configured to communicate via a proxy, by default. |
|
Proxy User Name, Proxy Password, and Confirm Password |
If the proxy server requires authentication, then, specify a valid proxy user name and password in the Proxy User Name and Proxy Password parameters, respectively. Then, confirm the password by retyping it in the Confirm Password text box. By default, these parameters are set to none, indicating that the proxy sever does not require authentication by default. |
|
Proxy Domain and Proxy Workstation |
If a Windows NTLM proxy is to be configured for use, then additionally, you will have to configure the Windows domain name and the Windows workstation name required for the same against the Proxy Domain and Proxy Workstation parameters. If the environment does not support a Windows NTLM proxy, set these parameters to none. |
|
Show DD Minimum Mbps |
This parameter specifies the minimum data transfer rate (in Mbps) that must be recorded for a Flow Log event in order for Detailed Diagnosis data to be generated and displayed. By default, this parameter is set to 5 Mbps. The test compares the data transferred by each Flow Log event against this configured threshold. If the transferred data exceeds the specified value, Detailed Diagnosis information will be available for that event, enabling deeper analysis of high-traffic flows. If the transferred data is less than or equal to the configured threshold, Detailed Diagnosis data will not be generated. |
|
Exclude Region |
Here, you can provide a comma-separated list of region names or patterns of region names that you do not want to monitor. For instance, to exclude regions with names that contain 'east' and 'west' from monitoring, your specification should be: *east*,*west* |
|
Default Connection Region |
By default, this test connects to the endpoint URL of the us-east-1 region to collect the required metrics. If the default us-east-1 region is not enabled in the target environment, then, for this test to collect the required metrics, specify the region that is enabled in the target environment. |
|
Top Info Display |
By default, this test reports metrics for the top-15 destinations, in terms of the data transferred to them. Accordingly, this parameter is set to 15 by default. You can have this test report metrics for more or less number of destinations by changing the value of this parameter. |
|
DD Frequency |
Refers to the frequency with which detailed diagnosis measures are to be generated for this test. The default is 1:1. This indicates that, by default, detailed measures will be generated every time this test runs, and also every time the test detects a problem. You can modify this frequency, if you so desire. Also, if you intend to disable the detailed diagnosis capability for this test, you can do so by specifying none against DD frequency. |
|
Detailed Diagnosis |
To make diagnosis more efficient and accurate, the eG Enterprise embeds an optional detailed diagnostic capability. With this capability, the eG agents can be configured to run detailed, more elaborate tests as and when specific problems are detected. To enable the detailed diagnosis capability of this test for a particular server, choose the On option. To disable the capability, click on the Off option. The option to selectively enable/disable the detailed diagnosis capability will be available only if the following conditions are fulfilled:
|
| Measurement | Description | Measurement Unit | Interpretation |
|---|---|---|---|
|
Packet transferred |
Indicates the number of packets transferred to this destination. |
Number |
Compare the value of this measure across destinations to know which destination is receiving the maximum traffic. You can then use the detailed diagnosis of this measure to view the complete details of the top-10 flows for that destination, in terms of the amount of data transferred to it. The details include the Source IP Address, Source Port, Destination IP Address, Destination Port, Packets Transferred, Data transferred, and Log status of each flow. From the Log status, you can quickly figure out whether the traffic handled by the flow was accepted by security groups/network policies or rejected. If many flows to a destination are rejected, you may have to investigate the reasons for the same, so that you do what is necessary to minimize or completely eliminate rejections. |
|
Data transferred |
Indicates the amount of data transferred to this destination. |
KB |
Compare the value of this measure across destinations to know which destination is receiving the maximum traffic. |
|
Data traffic |
Indicates what percentage of the total data handled by this interface was sent to this destination. |
Percent |
A value close to 100% for a destination indicates that almost all of the data handled by the interface was sent to that destination. By comparing the value of this measure across destinations, you can identify which destination is hogging the bandwidth resources. |
The detailed diagnosis of the Packets transferred measure reveals the complete details of the top-10 flows for a particular destination, in terms of the amount of data transferred to it. The details include the Source IP Address, Source Port, Destination IP Address, Destination Port, Packets Transferred, Data transferred, and Log status of each flow. From the Log status, you can quickly figure out whether the traffic handled by the flow was accepted by security groups/network policies or rejected. If many flows to a destination are rejected, you may have to investigate the reasons for the same, so that you do what is necessary to minimize or completely eliminate rejections. By studying the flows, you can also identify which flow has transmitted an abnormally high volume of data to this destination and which source transmitted that data. Such abnormal flows should be taken up for closer scrutiny.
![]()
Figure 2 : The detailed diagnosis of the Packets transferred measure of the AWS VPC Flow Logs - Destination test