AWS Kinesis Firehose Test
Amazon Kinesis Data Firehose is a fully managed service for delivering real-time streaming data to destinations such as Amazon Simple Storage Service (Amazon S3), Amazon Redshift, Amazon Elasticsearch Service (Amazon ES), and Splunk.
With Kinesis Data Firehose, you don't need to write applications or manage resources. You configure your data producers to send data to Kinesis data delivery streams using different sources: a Kinesis stream, the Kinesis Agent, or the Kinesis Firehose API using the AWS SDK. After data is sent to a delivery stream, it is automatically delivered to the destination you choose.
For instance, with Amazon Kinesis Data Firehose, you can capture data continuously from connected devices such as consumer appliances, embedded sensors, and TV set-top boxes. Amazon Kinesis Data Firehose loads the data into Amazon Redshift, enabling you to provide your customers near real-time access to metrics, insights, and dashboards.
If data/records sent by the delivery stream do not reach the intended destination, the analytics derived from that data may be incomplete, inaccurate, or unusuable. To avoid this, it is necessary to track the ingestion and transmission of data and records by the data delivery streams to each of the destinations and promptly capture delivery failures. This is where the AWS Kinesis Firehose test helps!
This test auto-discovers the data delivery streams created using Kinesis FireHose. For each delivery stream, the test tracks the delivery attempts made by that stream to each destination and reports the count of successful deliveries. This way, the test sheds light on delivery failures and the destinations to which delivery failed. Additionally, the test also measures the throughput of each delivery stream by reporting the number of records and amount of data received and processed by that stream. In the process, you can accurately identify those data delivery streams that are experiencing processing bottlenecks. To help you isolate what could be causing a stream to process data/records slowly, the test also reports the time taken by the stream to process different API calls. The API call/method that could be contributing to the slowness can thus be identified. The status of data transformation functions is also checked periodically, so that data transformation failures (if any) are brought to light.
Target of the test: Amazon Cloud
Agent deploying the test : A remote agent
Outputs of the test : One set of results for each data delivery stream
First-level descriptor: AWS Region
Second-level descriptor: Data delivery stream
| Parameter | Description |
|---|---|
|
Test Period |
How often should the test be executed. |
|
Host |
The host for which the test is to be configured. |
|
Access Type |
eG Enterprise monitors the AWS cloud using AWS API. By default, the eG agent accesses the AWS API using a valid AWS account ID, which is assigned a special role that is specifically created for monitoring purposes. Accordingly, the Access Type parameter is set to Role by default. Furthermore, to enable the eG agent to use this default access approach, you will have to configure the eG tests with a valid AWS Account ID to Monitor and the special AWS Role Name you created for monitoring purposes.
Some AWS cloud environments however, may not support the role-based approach Note that the Secret option may not be ideal when monitoring high-security cloud environments. This is because, such environments may issue a security mandate, which would require administrators to change the Access Key and Secret Key, often. Because of the dynamicity of the key-based approach, Amazon recommends the Role-based approach for accessing the AWS API. |
|
AWS Account ID to Monitor |
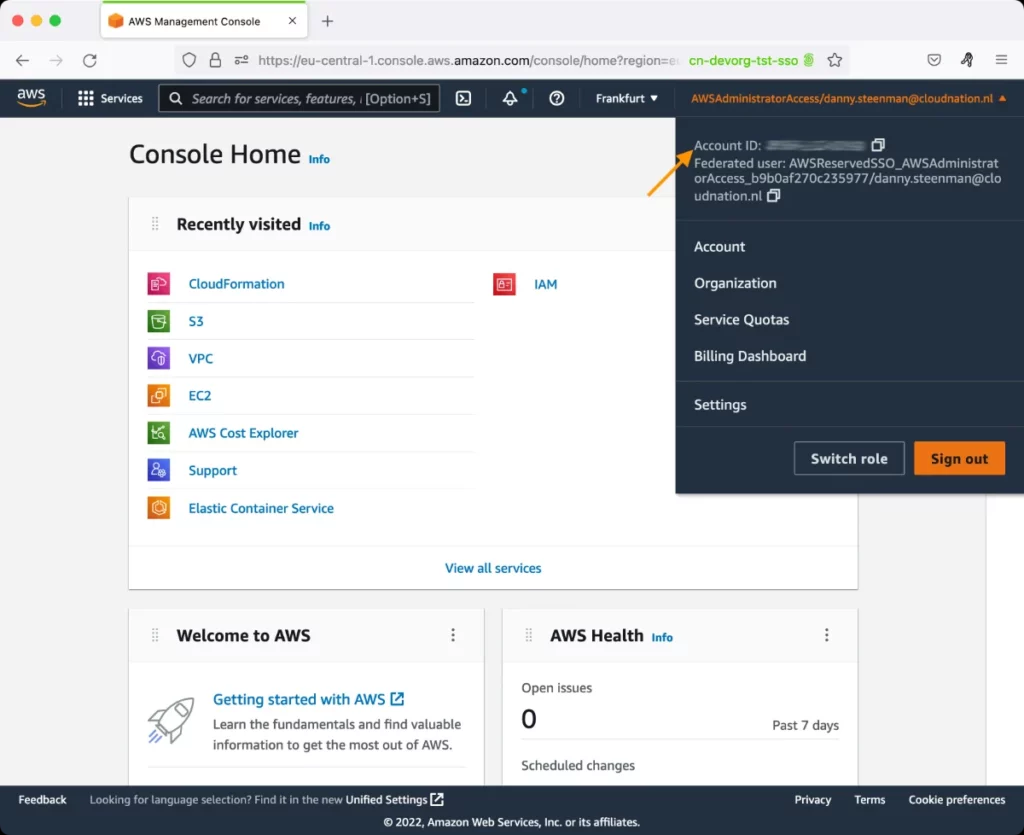
This parameter appears only when the Access Type parameter is set to Role. Specify the AWS Account ID that the eG agent should use for connecting and making requests to the AWS API. To determine your AWS Account ID, follow the steps below:
|
|
AWS Role Name |
This parameter appears when the Access Type parameter is set to Role. Specify the name of the role that you have specifically created on the AWS cloud for monitoring purposes. The eG agent uses this role and the configured Account ID to connect to the AWS Cloud and pull the required metrics. To know how to create such a role, refer to Creating a New Role. |
|
AWS Access Key, AWS Secret Key, Confirm AWS Access Key, Confirm AWS Secret Key |
These parameters appear only when the Access Type parameter is set to Secret.To monitor an Amazon cloud instance using the Secret approach, the eG agent has to be configured with the access key and secret key of a user with a valid AWS account. For this purpose, we recommend that you create a special user on the AWS cloud, obtain the access and secret keys of this user, and configure this test with these keys. The procedure for this has been detailed in the Obtaining an Access key and Secret key topic. Make sure you reconfirm the access and secret keys you provide here by retyping it in the corresponding Confirm text boxes. |
|
Proxy Host and Proxy Port |
In some environments, all communication with the AWS cloud and its regions could be routed through a proxy server. In such environments, you should make sure that the eG agent connects to the cloud via the proxy server and collects metrics. To enable metrics collection via a proxy, specify the IP address of the proxy server and the port at which the server listens against the Proxy Host and Proxy Port parameters. By default, these parameters are set to none , indicating that the eG agent is not configured to communicate via a proxy, by default. |
|
Proxy User Name, Proxy Password, and Confirm Password |
If the proxy server requires authentication, then, specify a valid proxy user name and password in the Proxy User Name and Proxy Password parameters, respectively. Then, confirm the password by retyping it in the Confirm Password text box. By default, these parameters are set to none, indicating that the proxy sever does not require authentication by default. |
|
Proxy Domain and Proxy Workstation |
If a Windows NTLM proxy is to be configured for use, then additionally, you will have to configure the Windows domain name and the Windows workstation name required for the same against the Proxy Domain and Proxy Workstation parameters. If the environment does not support a Windows NTLM proxy, set these parameters to none. |
|
Default Connection Region |
By default, this test connects to the endpoint URL of the us-east-1 region to collect the required metrics. If the default us-east-1 region is not enabled in the target environment, then, for this test to collect the required metrics, specify the region that is enabled in the target environment. |
|
Exclude Region |
Here, you can provide a comma-separated list of region names or patterns of region names that you do not want to monitor. For instance, to exclude regions with names that contain 'east' and 'west' from monitoring, your specification should be: *east*,*west* |
|
Measurement |
Description |
Measurement Unit |
Interpretation |
|---|---|---|---|
|
Data delivered to ES |
Indicates the amount of data that this data delivery stream indexed to Amazon ES. |
KB |
|
|
Records delivered to ES |
Indicates the number of records that this delivery stream indexed to Amazon ES. |
Number |
|
|
Total records delivered successfully to ES |
Indicates the number of successfully indexed records over the number of records that were attempted. |
Number |
A value lesser than 1 for this measure is indicative of delivery failures. |
|
Data delivered to RedShift |
Indicates the amount of data that this data delivery stream copied to Amazon RedShift. |
KB |
|
|
Records delivered to RedShift |
Indicates the number of records this data delivery stream copied to Amazon RedShift. |
Number |
|
|
Total records delivered successfully to RedShift |
Indicates the number of successful Amazon Redshift COPY commands over the number of all Amazon Redshift COPY commands that were issued by this data delivery stream. |
Number |
A value lesser than 1 for this measure is indicative of delivery failures. |
|
Data delivered to S3 |
Indicates the amount of data that this data delivery stream delivered to S3. |
Number |
|
|
Records delivered to S3 |
Indicates the number of records that this data delivery stream delivered to S3. |
Number |
|
|
Total records delivered successfully to S3 |
Indicates the number of successful Amazon S3 put commands over the number of all Amazon S3 put commands issued by this data delivery stream. |
Number |
A value lesser than 1 for this measure is indicative of delivery failures. |
|
Age of the oldest record |
Indicates the age (from getting into Kinesis Firehose to now) of the oldest record in this data delivery stream. |
Secs |
An abnormally high value for this measure could point to a record that is still in the data delivery stream and has not been delivered yet. The reasons for this delivery bottleneck will have to be investigated. |
|
Incoming data |
Indicates the amount of data coming into this data delivery stream. |
KB |
|
|
Incoming records |
Indicates the number of records ingested into this data delivery stream. |
Number |
|
|
Describedeliverystream latency |
Indicates the time taken by Kinesis Firehose to perform the DescribeDeliveryStream operation for this data delivery stream. |
Secs |
The DescribeDeliveryStream API command describes the specified delivery stream and gets the status. If any slowness or low throughput is noticed in a data delivery stream, then you can compare the value of this measure with the other latency measures that this test reports for that data delivery stream to know which API call is slowing down processing. |
|
Describedeliverystream erequests |
Indicates the total number of Describedeliverystream requests for this data delivery stream. |
Number |
|
|
Listdeliverystream operation latency |
Indicates the time taken by Kinesis Firehose to execute the Listdeliverystreams API call and return output for this data delivery stream. |
Secs |
The ListDeliveryStreams operation Lists your delivery streams. If any slowness or low throughput is noticed in a data delivery stream, then you can compare the value of this measure with the other latency measures that this test reports for that data delivery stream to know which API call is slowing down processing.
|
|
Listdeliverystream requests |
Indicates the total number of Listdeliverystream requests for this data delivery stream. |
Number |
|
|
Putrecord latency |
Indicates the time taken by Kinesis Firehose to execute the Putrecord API operation to write a record into this data delivery stream. |
Secs |
PutRecord writes a single data record into an Amazon Kinesis Firehose delivery stream. If any slowness or low throughput is noticed in a data delivery stream, then you can compare the value of this measure with the other latency measures that this test reports for that data delivery stream to know which API operation is slowing down processing. |
|
Putrecord requests |
Indicates the total number of Listdeliverystream requests for this data delivery stream. |
Number |
|
|
Putrecord data |
Indicates the amount of data put into this data delivery stream using the PutRecord API operation. |
KB |
The PutRecord and PutRecordBatch operations together can put a maximum of 5 MB of data per second into a delivery stream for the US East (N. Virginia), US West (Oregon), and EU (Ireland) regions. The limit is 1 MB/Sec for US East (Ohio), US West (N. California), Asia Pacific (Singapore), Asia Pacific (Sydney), Asia Pacific (Tokyo), and EU (Frankfurt) regions. You can submit a limit increase request using the Amazon Kinesis Data Firehose Limits form. If the increased limit is much higher than the running traffic, it causes very small delivery batches to destinations, which is inefficient and can result in higher costs at the destination services. Be sure to increase the limit only to match current running traffic, and increase the limit further if traffic increases. |
|
Putrecordbatch data |
Indicates the amount of data put into this data delivery stream using the PutRecordBatch API operation. |
KB |
The PutRecord and PutRecordBatch operations together can put a maximum of 5 MB of data per second into a delivery stream for the US East (N. Virginia), US West (Oregon), and EU (Ireland) regions. The limit is 1 MB/Sec for US East (Ohio), US West (N. California), Asia Pacific (Singapore), Asia Pacific (Sydney), Asia Pacific (Tokyo), and EU (Frankfurt) regions. You can submit a limit increase request using the Amazon Kinesis Data Firehose Limits form. If the increased limit is much higher than the running traffic, it causes very small delivery batches to destinations, which is inefficient and can result in higher costs at the destination services. Be sure to increase the limit only to match current running traffic, and increase the limit further if traffic increases. |
|
Putrecordbatch latency |
Indicates the time taken to put records into this data delivery stream using the PutRecordBatch API operation. |
Secs |
If any slowness or low throughput is noticed in a data delivery stream, then you can compare the value of this measure with the other latency measures that this test reports for that data delivery stream to know which API operation is slowing down processing. |
|
Putrecordbatch records |
Indicates the number of records that were added to this data delivery stream using the PutRecordBatch API operation. |
Number |
The PutRecord and PutRecordBatch operations together can put a maximum of 5000 records per second into a delivery stream for the US East (N. Virginia), US West (Oregon), and EU (Ireland) regions. The limit is 1000 records per second for US East (Ohio), US West (N. California), Asia Pacific (Singapore), Asia Pacific (Sydney), Asia Pacific (Tokyo), and EU (Frankfurt) regions. You can submit a limit increase request using the Amazon Kinesis Data Firehose Limits form. If the increased limit is much higher than the running traffic, it causes very small delivery batches to destinations, which is inefficient and can result in higher costs at the destination services. Be sure to increase the limit only to match current running traffic, and increase the limit further if traffic increases. |
|
Putrecordbatch request |
Indicates the total number of PutRecordBatch requests for this data delivery stream. |
Number |
|
|
Updatedeliverystream latency |
Indicates the time taken to update this data delivery stream using the UpdateDeliveryStream API operation. |
Secs |
If any slowness or low throughput is noticed in a data delivery stream, then you can compare the value of this measure with the other latency measures that this test reports for that data delivery stream to know which API operation is slowing down processing. |
|
Updatedeliverystream request |
Indicates the number of requests for UpdateDeliveryStream API operations for that data delivery stream. |
Number |
|
|
Lambda function invocation |
Indicates the time taken by Lambda function invocation for this data delivery stream. |
Secs |
Kinesis Data Firehose can invoke your Lambda function to transform incoming source data and deliver the transformed data to destinations. You can enable Kinesis Data Firehose data transformation when you create your delivery stream. This measure is reported for only those data delivery streams for which data transformation has been enabled. If any slowness or low throughput is noticed in a data delivery stream, then you can compare the value of this measure with the other latency measures that this test reports for that data delivery stream to know which API operation is slowing down processing. |
|
Successful Lambda function invocations |
Indicates the number of the successful Lambda function invocations over the number of the total Lambda function invocations by this data delivery stream. |
Number |
This measure is reported for only those data delivery streams for which data transformation has been enabled. A value less than 1 for this measure is indicative of one/more Lambda function invocation failures. Common causes for failure of Lambda invocations include a network timeout or reaching the Lambda invocation limit. In the event of such a failure, Kinesis Data Firehose retries the invocation three times by default. If the invocation does not succeed, Kinesis Data Firehose then skips that batch of records. The skipped records are treated as unsuccessfully processed records. |
|
Successfully processed data |
Indicates the amount of data that this data delivery stream has successfully processed. |
KB |
This measure is reported for only those data delivery streams for which data transformation has been enabled. |
|
Successfully processed records |
Indicates the number of records successfully processed by this data delivery stream. |
Number |
This measure is reported for only those data delivery streams for which data transformation has been enabled. For a data transformation-enabled data delivery stream, the value of this measure should be high ideally. A low value is indicative of data transformation failures. Common causes for failure of Lambda invocations include a network timeout or reaching the Lambda invocation limit. In the event of such a failure, Kinesis Data Firehose retries the invocation three times by default. If the invocation does not succeed, Kinesis Data Firehose then skips that batch of records. The skipped records are treated as unsuccessfully processed records. |