AWS Kinesis Streams Test
Amazon Kinesis Data Streams enables you to build custom applications that process or analyze streaming data for specialized needs. Kinesis Data Streams can continuously capture and store terabytes of data per hour from hundreds of thousands of sources such as website clickstreams, financial transactions, social media feeds, IT logs, and location-tracking events. With the Kinesis Client Library (KCL), you can build Kinesis Applications and use streaming data to power real-time dashboards, generate alerts, implement dynamic pricing and advertising, and more. You can also emit data from Kinesis Data Streams to other AWS services such as Amazon Simple Storage Service (Amazon S3), Amazon Redshift, Amazon EMR, and AWS Lambda.
The following diagram illustrates the high-level architecture of Kinesis Data Streams. A Kinesis data stream is nothing but an ordered sequence of data records. A data record is the unit of data stored in a Kinesis data stream. A shard is a uniquely identified group of data records in a stream. A stream is composed of one or more shards, each of which provides a fixed unit of capacity. The producers continually push data records or shards of data to Kinesis Data Streams and the consumers process the data in real time. Consumers (such as a custom application running on Amazon , or an Amazon Kinesis Data Firehose delivery stream) can store their results using an AWS service such as Amazon DynamoDB, Amazon Redshift, or Amazon S3.
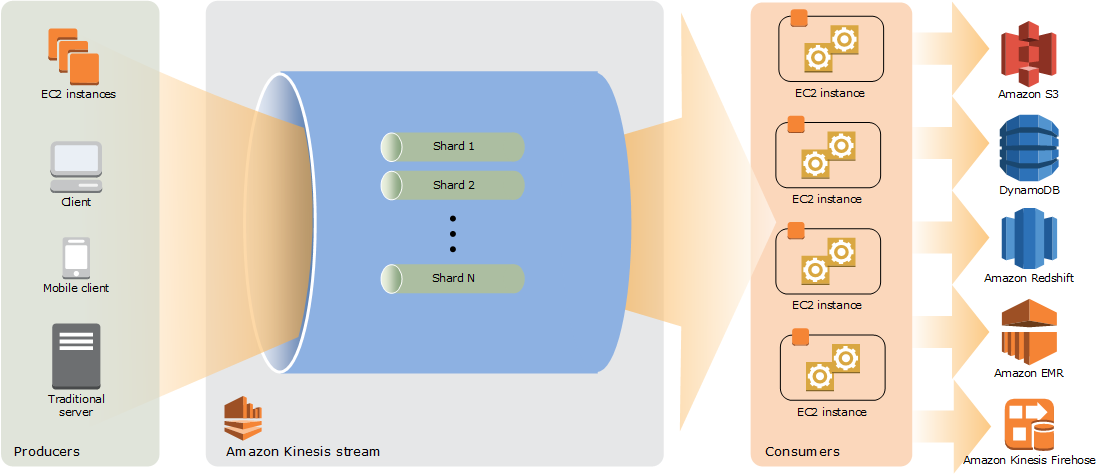
Figure 1 : High level architecture of Kinesis Data Streams
Typically, you can work with data streams - i.e., put records into a stream, read records from it , etc. - using the Amazon Kinesis Data Streams API. At run time, any delay that a custom application experiences when streaming / analyzing data can be attributed to the delay in execution of these API calls. To capture the Kinesis Data Stream that is experiencing such a slowness, and to pinpoint the source of the slowness, use the AWS Kinesis Streams test.
This test automatically discovers the Kinesis Data Streams, and for each stream reports the time taken to put records in and get records from that stream. The test also promptly notifies administrators if any API operation fails, thus enabling administrators to troubleshoot and fix the failure before it causes any serious damage to application performance. The actual and provisioned throughput for each stream is tracked, and any throttling that occurs due to a throughput threshold breach is brought to the attention of administrators, so that the stream capacity/configuration can be changed according to the load.
Target of the test: Amazon Cloud
Agent deploying the test : A remote agent
Outputs of the test : One set of results for each Kinesis data stream / shard
First-level descriptor: AWS Region
Second-level descriptor: Kinesis data stream / shard, depending upon the option chosen against the Kinesis Filter Name parameter.
| Parameter | Description |
|---|---|
|
Test Period |
How often should the test be executed. |
|
Host |
The host for which the test is to be configured. |
|
Access Type |
eG Enterprise monitors the AWS cloud using AWS API. By default, the eG agent accesses the AWS API using a valid AWS account ID, which is assigned a special role that is specifically created for monitoring purposes. Accordingly, the Access Type parameter is set to Role by default. Furthermore, to enable the eG agent to use this default access approach, you will have to configure the eG tests with a valid AWS Account ID to Monitor and the special AWS Role Name you created for monitoring purposes.
Some AWS cloud environments however, may not support the role-based approach Note that the Secret option may not be ideal when monitoring high-security cloud environments. This is because, such environments may issue a security mandate, which would require administrators to change the Access Key and Secret Key, often. Because of the dynamicity of the key-based approach, Amazon recommends the Role-based approach for accessing the AWS API. |
|
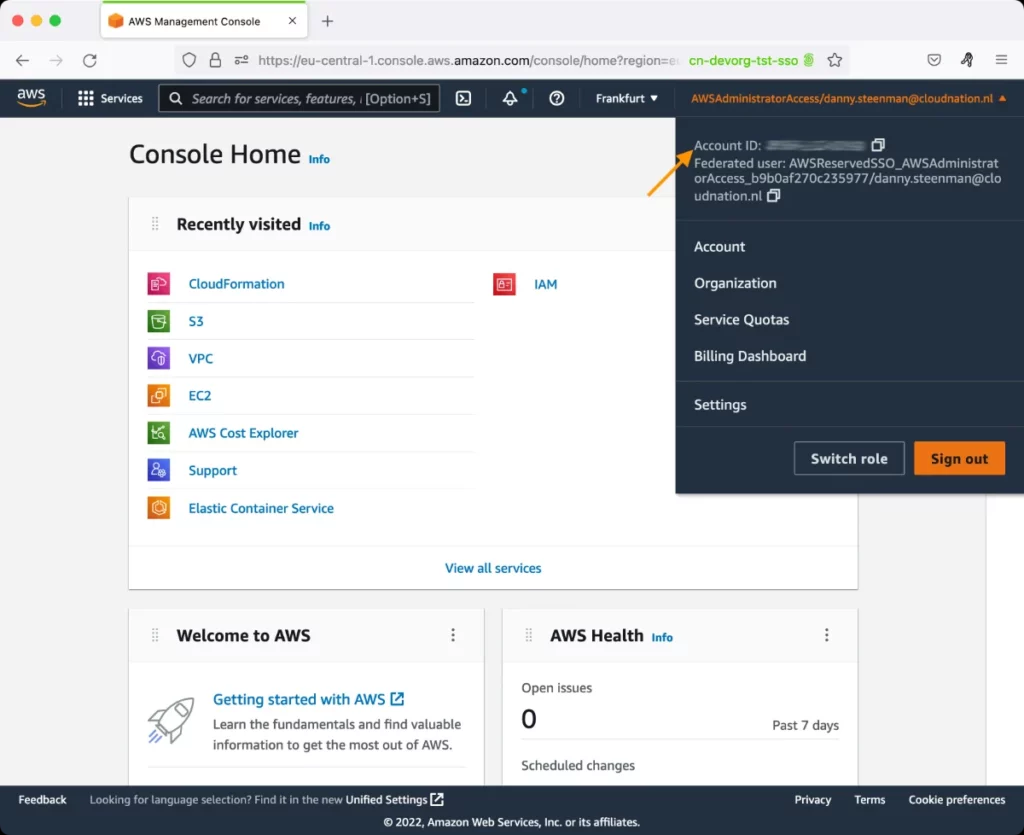
AWS Account ID to Monitor |
This parameter appears only when the Access Type parameter is set to Role. Specify the AWS Account ID that the eG agent should use for connecting and making requests to the AWS API. To determine your AWS Account ID, follow the steps below:
|
|
AWS Role Name |
This parameter appears when the Access Type parameter is set to Role. Specify the name of the role that you have specifically created on the AWS cloud for monitoring purposes. The eG agent uses this role and the configured Account ID to connect to the AWS Cloud and pull the required metrics. To know how to create such a role, refer to Creating a New Role. |
|
AWS Access Key, AWS Secret Key, Confirm AWS Access Key, Confirm AWS Secret Key |
These parameters appear only when the Access Type parameter is set to Secret.To monitor an Amazon cloud instance using the Secret approach, the eG agent has to be configured with the access key and secret key of a user with a valid AWS account. For this purpose, we recommend that you create a special user on the AWS cloud, obtain the access and secret keys of this user, and configure this test with these keys. The procedure for this has been detailed in the Obtaining an Access key and Secret key topic. Make sure you reconfirm the access and secret keys you provide here by retyping it in the corresponding Confirm text boxes. |
|
Proxy Host and Proxy Port |
In some environments, all communication with the AWS cloud and its regions could be routed through a proxy server. In such environments, you should make sure that the eG agent connects to the cloud via the proxy server and collects metrics. To enable metrics collection via a proxy, specify the IP address of the proxy server and the port at which the server listens against the Proxy Host and Proxy Port parameters. By default, these parameters are set to none , indicating that the eG agent is not configured to communicate via a proxy, by default. |
|
Proxy User Name, Proxy Password, and Confirm Password |
If the proxy server requires authentication, then, specify a valid proxy user name and password in the Proxy User Name and Proxy password parameters, respectively. Then, confirm the password by retyping it in the Confirm Password text box. By default, these parameters are set to none, indicating that the proxy sever does not require authentication by default. |
|
Proxy Domain and Proxy Workstation |
If a Windows NTLM proxy is to be configured for use, then additionally, you will have to configure the Windows domain name and the Windows workstation name required for the same against the Proxy Domain and Proxy Workstation parameters. If the environment does not support a Windows NTLM proxy, set these parameters to none. |
|
Exclude Region |
Here, you can provide a comma-separated list of region names or patterns of region names that you do not want to monitor. For instance, to exclude regions with names that contain 'east' and 'west' from monitoring, your specification should be: *east*,*west* |
|
Default Connection Region |
By default, this test connects to the endpoint URL of the us-east-1 region to collect the required metrics. If the default us-east-1 region is not enabled in the target environment, then, for this test to collect the required metrics, specify the region that is enabled in the target environment. |
|
Kinesis Filter Name |
By default, this test reports metrics for each Kinesis data stream. Accordingly, this parameter is set to Streamname by default. If required, you can override this default setting by configuring the test to report metrics for each Shard, instead. For this, select the ShardId option from the Kinesis Filter Name drop-down. |
|
Measurement |
Description |
Measurement Unit |
Interpretation |
|---|---|---|---|
|
Getrecords operation data |
Indicates the amount of data retrieved by the GetRecords API operation from this data stream. |
KB |
This measure is not reported for a shard - i.e., if the Kinesis Filter Name is set to ShardId, then this measure will not be reported. |
|
Getrecords iterator |
By default, this measure represents the age of the last record in all GetRecords calls made to all shards in this data stream. If the Kinesis Filter Name is set to ShardId, then this measure represents the age of the last record in all GetRecords calls made to this shard.
|
Secs |
Age is the difference between the current time and when the last record of the GetRecords call was written to the stream. A value of zero indicates that the records being read are completely caught up with the stream. |
|
Getrecords operation latency |
Indicates the time taken per GetRecords operation performed on this data stream. |
Secs |
This measure is not reported for a shard - i.e., if the Kinesis Filter Name is set to ShardId, then this measure will not be reported. Ideally, the value of this measure should be low. A high value indicates that the GetRecords API operation is very slow. Compare the value of this measure across data streams to know for which data stream the GetRecords operation is slowest. |
|
Getrecords operation retrieved |
Indicates the number of records retrieved from this data stream by the GetRecords API operation. |
Number |
This measure is not reported for a shard - i.e., if the Kinesis Filter Name is set to ShardId, then this measure will not be reported. |
|
Getrecords operation success |
Indicates the number of successful Getrecords API operations for this data stream. |
Number |
This measure is not reported for a shard - i.e., if the Kinesis Filter Name is set to ShardId, then this measure will not be reported. Ideally, the value of this measure should be high. |
|
Incoming data |
By default, this measure represents the total amount of data put into all shards in this data stream, by PutRecord and PutRecords operations. If the Kinesis Filter Name is set to ShardId, then this measure represents the total amount of data put into this shard by PutRecord and PutRecords operations. |
KB |
|
|
Incoming records |
By default, this measure represents the total number of records put into all shards in this data stream, by PutRecord and PutRecords operations. If the Kinesis Filter Name is set to ShardId, then this measure represents the total number of records put into this shard by PutRecord and PutRecords operations. |
Number |
|
|
Outgoing data |
By default, this measure represents the total amount of data retrieved from all shards in this data stream. If the Kinesis Filter Name is set to ShardId, then this measure represents the total amount of data retrieved from this shard. |
KB |
|
|
Outgoing records |
By default, this measure represents the total number of records retrieved from all shards in this data stream. If the Kinesis Filter Name is set to ShardId, then this measure represents the total number of records retrieved from this shard. |
Number |
|
|
Putrecord operation data |
Indicates the amount of data put into this data stream. by the PutRecord API operation. |
KB |
This measure is not reported for a shard - i.e., if the Kinesis Filter Name is set to ShardId, then this measure will not be reported. Each call to PutRecord operates on a single record. Prefer the PutRecords operation unless your application specifically needs to always send single records per request, or some other reason PutRecords can't be used. |
|
Putrecord operation latency |
Indicates the time taken per PutRecord API operation performed on this data stream. |
Secs |
This measure is not reported for a shard - i.e., if the Kinesis Filter Name is set to ShardId, then this measure will not be reported. Ideally, the value of this measure should be low. A high value indicates that the PutRecord API operation is very slow. Compare the value of this measure across data streams to know for which data stream the PutRecord operation is slowest. |
|
Putrecord operation success |
Indicates the number of successful PutRecord API operations for this data stream. |
Number |
This measure is not reported for a shard - i.e., if the Kinesis Filter Name is set to ShardId, then this measure will not be reported. Ideally, the value of this measure should be high. |
|
Putrecords operation data |
Indicates the amount of data put into this data stream. by the PutRecords API operation. |
KB |
This measure is not reported for a shard - i.e., if the Kinesis Filter Name is set to ShardId, then this measure will not be reported. The PutRecords operation sends multiple records to Kinesis Data Streams in a single request. By using PutRecords, producers can achieve higher throughput when sending data to their Kinesis data stream. Each record in the request can be as large as 1 MB, up to a limit of 5 MB for the entire request |
|
Putrecords operation latency |
Indicates the time taken per PutRecords API operation performed on this data stream. |
Secs |
This measure is not reported for a shard - i.e., if the Kinesis Filter Name is set to ShardId, then this measure will not be reported. Ideally, the value of this measure should be low. A high value indicates that the PutRecords API operation is very slow. Compare the value of this measure across data streams to know for which data stream the PutRecords operation is slowest. |
|
Putrecords operation success |
Indicates the number of PutRecords API operations, where at least one record succeeded for this data stream. |
Number |
Ideally, the value of this measure should be high. A low value is indicative of a high failure rate of PutRecords operations. By default, failure of individual records within a request does not stop the processing of subsequent records in a PutRecords request. This means that a response Records array includes both successfully and unsuccessfully processed records. You must detect unsuccessfully processed records and include them in a subsequent call. |
|
Read provision throughput exceeded |
By default, this measure represents the number of GetRecords calls throttled for this data stream. If the Kinesis Filter Name is set to ShardId, then this measure represents the number of GetRecords calls throttled for this shard. |
Number |
The maximum size of data that GetRecords can return is 10 MB. If a call returns this amount of data, subsequent calls made within the next five seconds throw ProvisionedThroughputExceededException. If there is insufficient provisioned throughput on the stream, subsequent calls made within the next one second throw ProvisionedThroughputExceededException. This exception implies that the request rate for the stream is too high, or the requested data is too large for the available throughput. The recommended solution for this problem is to reduce the frequency or size of your requests. |
|
Write provision throughput exceeded |
By default, this measure represents the number of PutRecord and PutRecords calls throttled for this data stream. If the Kinesis Filter Name is set to ShardId, then this measure represents the number of PutRecord and PutRecords calls throttled for this shard. |
Number |
If a PutRecord request cannot be processed because of insufficient provisioned throughput on the shard involved in the request, PutRecord throws ProvisionedThroughputExceededException. This exception implies that the request rate for the stream is too high, or the requested data is too large for the available throughput. The recommended solution for this problem is to reduce the frequency or size of your requests. |
|
GetRecords Iterator age |
Indicates the age of the last record in all GetRecords calls made against a shard, measured. By default, this measure represents the age of the last record in all GetRecords calls made to all shards in this data stream. |
Secs |
|