AWS RDS Events Test
Amazon RDS (Relational Database Service) generates a significant number of events in categories that you can subscribe to using the Amazon RDS Console, AWS CLI, or the API. Each category applies to a source type.
Administrators may want to track these events, particularly problem events (eg., failure events, low storage events etc.), so that they instantly detect and promptly resolve issues in the AWS RDS service. This is where the AWS RDS Events test helps!
This test reports the count of events of different categories that Amazon RDS periodically generates. Alerts are sent out if problem events are captured. Detailed diagnostics describe the problem events, so that you can quickly tell where and why the problem occurred. This way, the test helps in rapidly identifying and efficiently troubleshooting RDS-related issues.
Target of the test: Amazon Cloud
Agent deploying the test : A remote agent
Outputs of the test : One set of results for each type of event source in each region of the AWS cloud - the source type can be a DB instance / DB parameter group / DB security group / DB snapshot / RDS proxy
First-level descriptor: AWS region name
Second-level descriptor: Event source type
| Parameter | Description |
|---|---|
|
Test Period |
How often should the test be executed. |
|
Host |
The host for which the test is to be configured. |
|
Access Type |
eG Enterprise monitors the AWS cloud using AWS API. By default, the eG agent accesses the AWS API using a valid AWS account ID, which is assigned a special role that is specifically created for monitoring purposes. Accordingly, the Access Type parameter is set to Role by default. Furthermore, to enable the eG agent to use this default access approach, you will have to configure the eG tests with a valid AWS Account ID to Monitor and the special AWS Role Name you created for monitoring purposes.
Some AWS cloud environments however, may not support the role-based approach Note that the Secret option may not be ideal when monitoring high-security cloud environments. This is because, such environments may issue a security mandate, which would require administrators to change the Access Key and Secret Key, often. Because of the dynamicity of the key-based approach, Amazon recommends the Role-based approach for accessing the AWS API. |
|
AWS Account ID to Monitor |
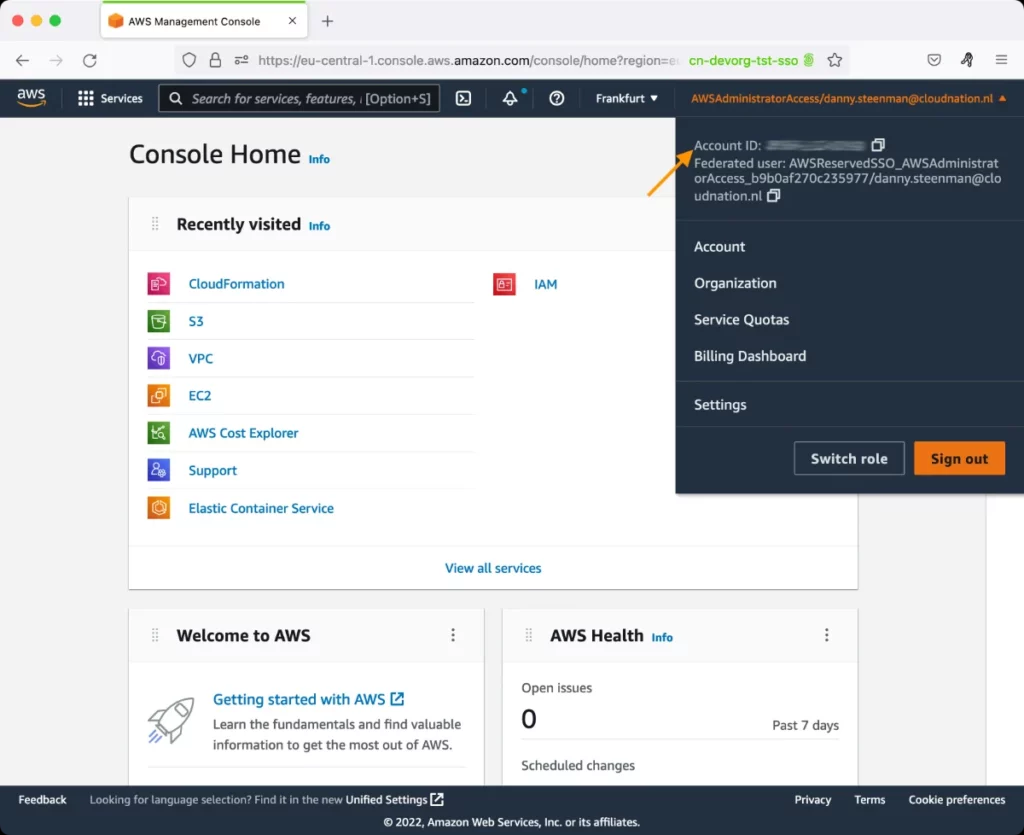
This parameter appears only when the Access Type parameter is set to Role. Specify the AWS Account ID that the eG agent should use for connecting and making requests to the AWS API. To determine your AWS Account ID, follow the steps below:
|
|
AWS Role Name |
This parameter appears when the Access Type parameter is set to Role. Specify the name of the role that you have specifically created on the AWS cloud for monitoring purposes. The eG agent uses this role and the configured Account ID to connect to the AWS Cloud and pull the required metrics. To know how to create such a role, refer to Creating a New Role. |
|
AWS Access Key, AWS Secret Key, Confirm AWS Access Key, Confirm AWS Secret Key |
These parameters appear only when the Access Type parameter is set to Secret.To monitor an Amazon cloud instance using the Secret approach, the eG agent has to be configured with the access key and secret key of a user with a valid AWS account. For this purpose, we recommend that you create a special user on the AWS cloud, obtain the access and secret keys of this user, and configure this test with these keys. The procedure for this has been detailed in the Obtaining an Access key and Secret key topic. Make sure you reconfirm the access and secret keys you provide here by retyping it in the corresponding Confirm text boxes. |
|
Proxy Host and Proxy Port |
In some environments, all communication with the AWS cloud and its regions could be routed through a proxy server. In such environments, you should make sure that the eG agent connects to the cloud via the proxy server and collects metrics. To enable metrics collection via a proxy, specify the IP address of the proxy server and the port at which the server listens against the Proxy Host and Proxy Port parameters. By default, these parameters are set to none , indicating that the eG agent is not configured to communicate via a proxy, by default. |
|
Proxy User Name, Proxy Password, and Confirm Password |
If the proxy server requires authentication, then, specify a valid proxy user name and password in the Proxy User Name and Proxy Password parameters, respectively. Then, confirm the password by retyping it in the Confirm Password text box. By default, these parameters are set to none, indicating that the proxy sever does not require authentication by default. |
|
Proxy Domain and Proxy Workstation |
If a Windows NTLM proxy is to be configured for use, then additionally, you will have to configure the Windows domain name and the Windows workstation name required for the same against the proxy domain and proxy workstation parameters. If the environment does not support a Windows NTLM proxy, set these parameters to none. |
|
Default Connection Region |
By default, this test connects to the endpoint URL of the us-east-1 region to collect the required metrics. If the default us-east-1 region is not enabled in the target environment, then, for this test to collect the required metrics, specify the region that is enabled in the target environment. |
|
Exclude Region |
Here, you can provide a comma-separated list of region names or patterns of region names that you do not want to monitor. For instance, to exclude regions with names that contain 'east' and 'west' from monitoring, your specification should be: *east*,*west* |
|
Detailed Diagnosis |
To make diagnosis more efficient and accurate, the eG Enterprise embeds an optional detailed diagnostic capability. With this capability, the eG agents can be configured to run detailed, more elaborate tests as and when specific problems are detected. To enable the detailed diagnosis capability of this test for a particular server, choose the On option. To disable the capability, click on the Off option. The option to selectively enable/disable the detailed diagnosis capability will be available only if the following conditions are fulfilled:
|
| Measurement | Description | Measurement Unit | Interpretation |
|---|---|---|---|
|
Creation events |
Indicates the number of Creation events generated by this event source. |
Number |
Creation events are typically generated, when:
To know which of the aforesaid activities triggered the Creation events, when, and in which region, use the detailed diagnosis of this measure. |
|
Availability events |
Indicates the number of Availability events generated by this event source. |
Number |
Availability events are typically generated, when:
To know which of the aforesaid activities triggered the Availability events, when, and in which region, use the detailed diagnosis of this measure. |
|
Configuration change events |
Indicates the number of Configuration change events generated by this event source. |
Number |
Configuration change events are typically generated, when:
To know which of the aforesaid activities triggered the Configuration change events, when, and in which region, use the detailed diagnosis of this measure. |
|
Low storage events |
Indicates the number of Low storage events generated by this event source. |
Number |
Low storage events are typically generated, when:
To know which of the aforesaid activities triggered the Low storage events, when, and in which region, use the detailed diagnosis of this measure. |
|
Notification events |
Indicates the number of Notification events generated by this event source. |
Number |
Notification events are typically generated, when:
To know which of the aforesaid activities triggered the Notification events, when, and in which region, use the detailed diagnosis of this measure. |
|
Read replica events |
Indicates the number of Read replica events generated by this event source. |
Number |
Read replica events are typically generated, when:
To know which of the aforesaid activities triggered the Read replica events, when, and in which region, use the detailed diagnosis of this measure. |
|
Recovery events |
Indicates the number of Recovery events generated by this event source. |
Number |
Recovery events are typically generated, when:
To know which of the aforesaid activities triggered the Recovery events, when, and in which region, use the detailed diagnosis of this measure. |
|
Restoration events |
Indicates the number of Restoration events generated by this event source. |
Number |
Restoration events are typically generated, when the DB instance is restored from a point-in-time backup / DB snapshot; To know which of the aforesaid activities triggered the Restoration events, when, and in which region, use the detailed diagnosis of this measure. |
|
Backup events |
Indicates the number of Backup events generated by this event source. |
Number |
Backup events are typically generated, when:
To know which of the aforesaid activities triggered the Backup events, when, and in which region, use the detailed diagnosis of this measure. |
|
Maintenance events |
Indicates the number of Maintenance events generated by this event source. |
Number |
Maintenance events are typically generated, when:
To know which of the aforesaid activities triggered the Maintenance events, when, and in which region, use the detailed diagnosis of this measure. |
|
Failover events |
Indicates the number of Failover events generated by this event source. |
Number |
Failover events are typically generated, when:
To know which of the aforesaid activities triggered the Failover events, when, and in which region, use the detailed diagnosis of this measure. |
|
Failure events |
Indicates the number of Failure events generated by this event source. |
Number |
Failure events are typically generated, when:
To know which of the aforesaid activities triggered the Failure events, when, and in which region, use the detailed diagnosis of this measure. |
|
Deletion events |
Indicates the number of Deletion events generated by this event source. |
Number |
Deletion events are typically generated, when:
To know which of the aforesaid activities triggered the Deletion events, when, and in which region, use the detailed diagnosis of this measure. |
Note:
If Amazon RDS does not generate any event, then this test will not be able to report any metrics. To handle such situations, this test supports a Summary descriptor. As long as the Amazon RDS service generates at least one event, the Summary descriptor will not even be visible in the eG monitoring console. On the contrary, if the service does not even generate a single event, then this test will report measures for the Summary descriptor alone. In this case, the test will report the value 0 for the Creation events, Availability events, Failure events, and Deletion events measures of the Summary descriptor. Other measures will not appear in the eG monitoring console.