AWS RedShift Test
Amazon Redshift is a fully managed, petabyte-scale data warehouse service in the cloud. The first step to create such a data warehouse is to launch an Amazon Redshift cluster. An Amazon Redshift cluster is a collection of computing resources called nodes. Each cluster runs an Amazon Redshift engine and contains one or more databases. Each cluster has a leader node and one or more compute nodes. The leader node receives queries from client applications, parses the queries, and develops query execution plans. The leader node then coordinates the parallel execution of these plans with the compute nodes, aggregates the intermediate results from these nodes, and finally returns the results back to the client applications. Compute nodes execute the query execution plans and transmit data among themselves to serve these queries. The intermediate results are sent back to the leader node for aggregation before being sent back to the client applications.
Where RedShift is in use, query performance, and consequently, the performance of the dependent client applications, depends upon the following factors:
- Cluster availability
- How the cluster and its nodes use the CPU, network, and storage resources of the cluster;
- Responsiveness of the nodes in the cluster to I/O requests from client applications
To be able to accurately assess whether cluster performance is at the desired level or not, an administrator would require real-time insights into each of the factors listed above. The AWS RedShift test provides administrators with these valuable insights. By reporting the current health status of each cluster managed by RedShift, this test brings unavailable clusters to light. The resource usage of the cluster is also reported, so that potential resource contentions can be proactively isolated. Optionally, you can also configure this test to report metrics for individual nodes in the cluster as well. If this is done, then administrators will be able to instantly drill-down from a resource-hungry cluster to the exact node in the cluster that could hogging the resources. At the node-level, the latency and throughput of each node is also revealed. This way, when users complain of degradation in the performance of client applications, you can quickly identify the cluster and the precise node in the cluster that is slowing down I/O processing and consequently, impacting application performance.
Target of the test: Amazon Cloud
Agent deploying the test: A remote agent
Output of the test: One set of results for each cluster and/or node in every AWS region on the cloud monitored
First level descriptor: AWS Region
Second level descriptor: Cluster
Third-level descriptor: Node
| Parameter | Description |
|---|---|
|
Test Period |
How often should the test be executed. |
|
Host |
The host for which the test is to be configured. |
|
Access Type |
eG Enterprise monitors the AWS cloud using AWS API. By default, the eG agent accesses the AWS API using a valid AWS account ID, which is assigned a special role that is specifically created for monitoring purposes. Accordingly, the Access Type parameter is set to Role by default. Furthermore, to enable the eG agent to use this default access approach, you will have to configure the eG tests with a valid AWS Account ID to Monitor and the special AWS Role Name you created for monitoring purposes.
Some AWS cloud environments however, may not support the role-based approach Note that the Secret option may not be ideal when monitoring high-security cloud environments. This is because, such environments may issue a security mandate, which would require administrators to change the Access Key and Secret Key, often. Because of the dynamicity of the key-based approach, Amazon recommends the Role-based approach for accessing the AWS API. |
|
AWS Account ID to Monitor |
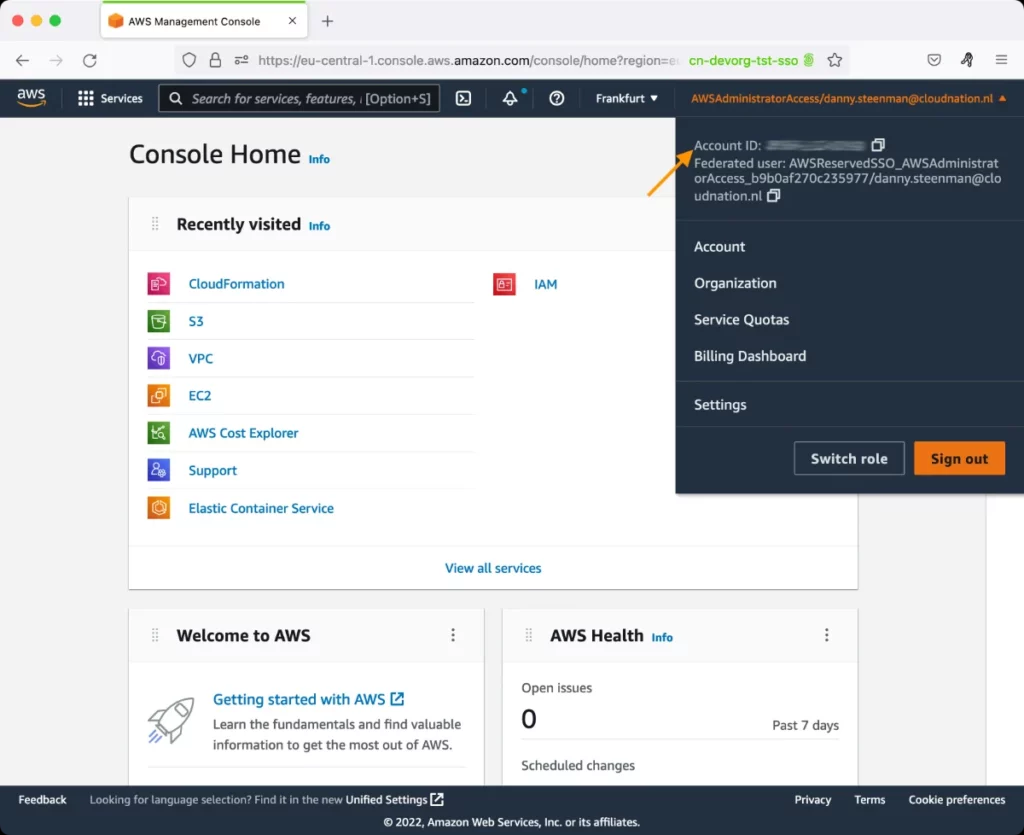
This parameter appears only when the Access Type parameter is set to Role. Specify the AWS Account ID that the eG agent should use for connecting and making requests to the AWS API. To determine your AWS Account ID, follow the steps below:
|
|
AWS Role Name |
This parameter appears when the Access Type parameter is set to Role. Specify the name of the role that you have specifically created on the AWS cloud for monitoring purposes. The eG agent uses this role and the configured Account ID to connect to the AWS Cloud and pull the required metrics. To know how to create such a role, refer to Creating a New Role. |
|
AWS Access Key, AWS Secret Key, Confirm AWS Access Key, Confirm AWS Secret Key |
These parameters appear only when the Access Type parameter is set to Secret.To monitor an Amazon cloud instance using the Secret approach, the eG agent has to be configured with the access key and secret key of a user with a valid AWS account. For this purpose, we recommend that you create a special user on the AWS cloud, obtain the access and secret keys of this user, and configure this test with these keys. The procedure for this has been detailed in the Obtaining an Access key and Secret key topic. Make sure you reconfirm the access and secret keys you provide here by retyping it in the corresponding Confirm text boxes. |
|
Proxy Host and Proxy Port |
In some environments, all communication with the AWS cloud and its regions could be routed through a proxy server. In such environments, you should make sure that the eG agent connects to the cloud via the proxy server and collects metrics. To enable metrics collection via a proxy, specify the IP address of the proxy server and the port at which the server listens against the Proxy Host and Proxy Port parameters. By default, these parameters are set to none , indicating that the eG agent is not configured to communicate via a proxy, by default. |
|
Proxy User Name, Proxy Password, and Confirm Password |
If the proxy server requires authentication, then, specify a valid proxy user name and password in the proxy user name and proxy password parameters, respectively. Then, confirm the password by retyping it in the CONFIRM PASSWORD text box. By default, these parameters are set to none, indicating that the proxy sever does not require authentication by default. |
|
Proxy Domain and Proxy Workstation |
If a Windows NTLM proxy is to be configured for use, then additionally, you will have to configure the Windows domain name and the Windows workstation name required for the same against the proxy domain and proxy workstation parameters. If the environment does not support a Windows NTLM proxy, set these parameters to none. |
|
Exclude Region |
Here, you can provide a comma-separated list of region names or patterns of region names that you do not want to monitor. For instance, to exclude regions with names that contain 'east' and 'west' from monitoring, your specification should be: *east*,*west* |
|
Default Connection Region |
By default, this test connects to the endpoint URL of the us-east-1 region to collect the required metrics. If the default us-east-1 region is not enabled in the target environment, then, for this test to collect the required metrics, specify the region that is enabled in the target environment. |
|
RedShift Filter Name |
By default, this test reports metrics only for each cluster in each AWS region on the cloud. This is why, this flag is set to ClusterIdentifier, by default. If needed, you can configure the test to additionally report metrics for every node in every cluster. For node-level metrics, select the NodeIdentifer option from this drop-down. Upon selection, you will be able to view metrics both at the cluster-level and the node-level. |
|
Measurement |
Description |
Measurement Unit |
Interpretation |
||||||
|---|---|---|---|---|---|---|---|---|---|
|
CPU utilization: |
Indicates the percentage of CPU utilized by this cluster/node. |
Percent |
For a cluster, this measure will report the aggregate CPU usage of all nodes in the cluster. If the value of this measure is consistently above 50% for a cluster, it indicates that a serious resource contention may occur on that cluster, if additional processing power is not provided to it. In such a case, you may want to consider adding more nodes to the cluster, or adding more CPUs to the existing nodes. You can also compare the CPU usage of nodes in the resource-hungry cluster to determine whether one/more nodes are hogging the CPU. If so, you may want to tweak the load-balancing algorithm of your cluster to ensure uniform load distribution.
|
||||||
|
Database connections:
|
Indicates the number of connections to the databases in this cluster. |
Number |
This measure is only reported at the cluster-level and not the node-level. |
||||||
|
Health status: |
Indicates the current health status of this cluster. |
Percent |
This measure is only reported at the cluster-level and not the node-level. Every minute the cluster connects to its database and performs a simple query. If it is able to perform this operation successfully, then the value of this measure will be Healthy. Otherwise, the value of this measure will be Unhealthy. An Unhealthy status can occur when the cluster database is under extremely heavy load or if there is a configuration problem with a database on the cluster. The numeric values that correspond to the measure values mentioned above are as follows:
Note: This measure will report one of the Measure Values listed above to indicate the current state of a cluster. In the graph of this measure however, cluster status will be indicated using the numeric equivalents only. |
||||||
|
Is maintenance mode?: |
Indicates whether/not this cluster is in the maintenance mode presently. |
|
The values that this measure can report and their corresponding numeric values are listed in the table below:
Note:
|
||||||
|
Network receive throughput: |
Indicates the rate at which this cluster or node receives data. |
KB/Secs |
For a cluster, a consistent increase in the value of these measures is indicative of excessive usage of network resources by the cluster. In such a case, compare the value of these measures across the nodes of a cluster to identify the nodes that are over-utilizing network bandwidth.
|
||||||
|
Network transmit throughput: |
Indicates the rate at which this cluster or node sends data. |
KB/Secs |
|||||||
|
Disk space used: |
Indicates the percentage of disk space used by this cluster/node. |
Percent |
If the value of this measure is close to 100% for a cluster, it indicates that the cluster is rapidly running out of storage resources. You may want to consider adding more nodes to the cluster to increase the storage space available. Alternatively, you can add fewer nodes and yet significantly increase the cluster resources by opting for node types that are by default large-sized and hence come bundled with considerable storage space. When a cluster's storage resources are rapidly depleting, you may want to compare the space usage of the nodes in cluster, so that you can quickly isolate that node that is eroding the space. Tweaking your load-balancing algorithm could go a long way in eliminating such node overloads. |
||||||
|
Read IOPS: |
Indicates the average number of disk read operations performed by this node per second. |
Reads/Sec |
A high value is desired for this measure, as that's the trait of a healthy node. You can compare the value of this measure across nodes to identify the node that is slowest in processing read requests. |
||||||
|
Read latency: |
Indicates the average amount of time taken by this node for disk read I/O operations. |
Reads/Sec |
Ideally, the value of this measure should be very low. Its good practice to compare the value of this measure across nodes of a cluster and isolate those nodes in the cluster where the value of this measure is abnormally high. Such nodes slow down I/O processing and adversely affect application performance. |
||||||
|
Read throughput: |
Indicates the average number of bytes read from disk by this node per second. |
KB/Sec |
A high throughput signifies faster processing of read I/O requests. A low throughput is indicative of slow read request processing. Compare the value of this measure across nodes of a cluster to isolate those nodes that have registered an abnormally low value for this measure. Such nodes not only affect cluster performance, but also the performance of dependent client applications. |
||||||
|
Write IOPS: |
Indicates the average number o disk write operations performed by this node per second. |
Writes/Sec |
A high value is desired for this measure, as that's the trait of a healthy node. You can compare the value of this measure across nodes to identify the node that is slowest in processing write requests. |
||||||
|
Write latency: |
Indicates the average amount of time taken by this node for disk write I/O operations. |
Secs |
Ideally, the value of this measure should be very low. Its good practice to compare the value of this measure across nodes of a cluster and isolate those nodes in the cluster where the value of this measure is abnormally high. Such nodes slow down I/O processing and adversely affect application performance. |
||||||
|
Write throughput: |
Indicates the average number of bytes written to disk by this node per second. |
KB/Sec |
A high throughput signifies faster processing of write I/O requests. A low throughput is indicative of slow write request processing. Compare the value of this measure across nodes of a cluster to isolate those nodes that have registered an abnormally low value for this measure. Such nodes not only affect cluster performance, but also the performance of dependent client applications. |