Enabling Resource Metrics for S3 Bucket
To enable Resource Metrics collection for the S3 buckets to be monitored, do the following:
-
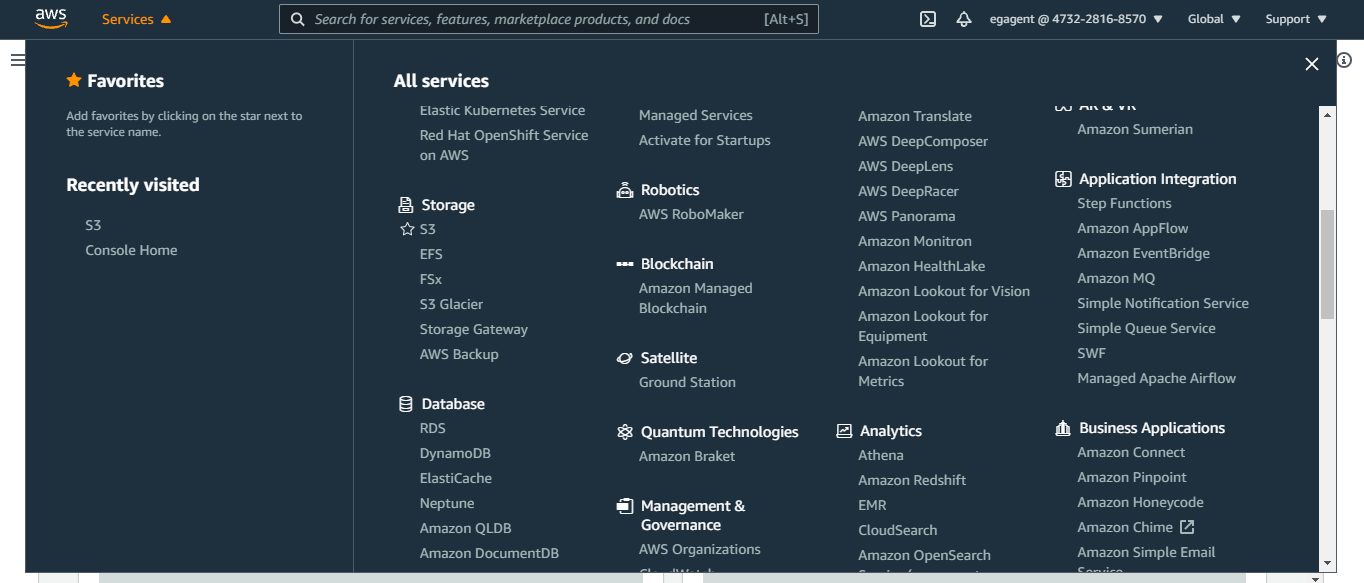
Sign into the AWS Management Console and select S3 from the Services menu at the top of the console (see Figure 1).
-
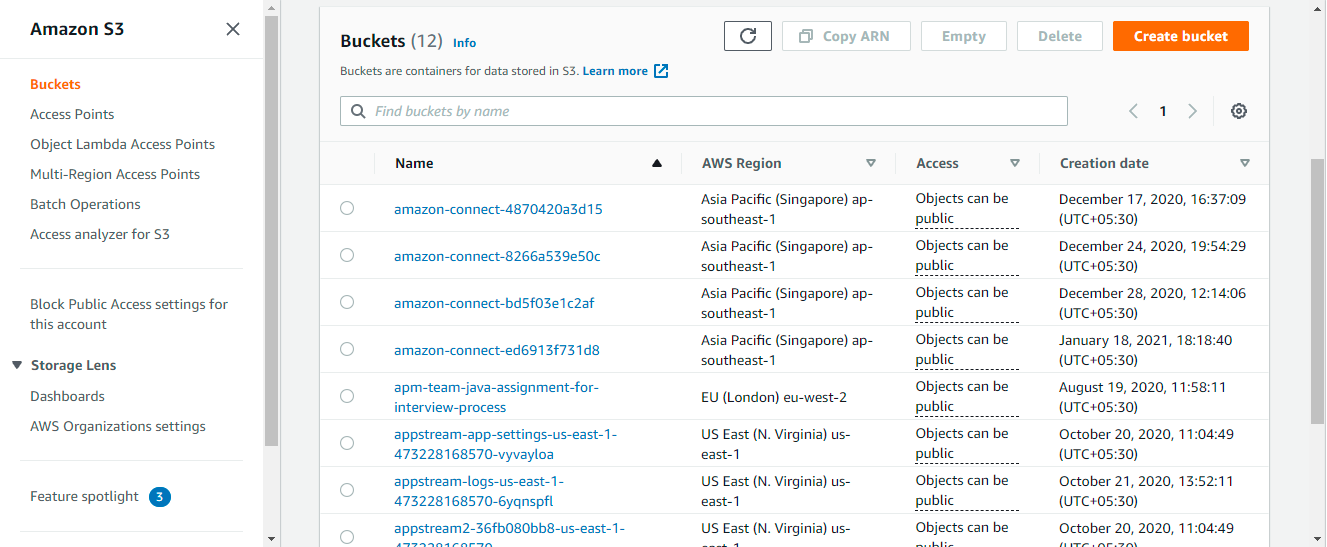
Figure 2 will then appear. From the Buckets list in the left panel of Figure 2, choose the bucket you want to monitor by clicking on it.
-
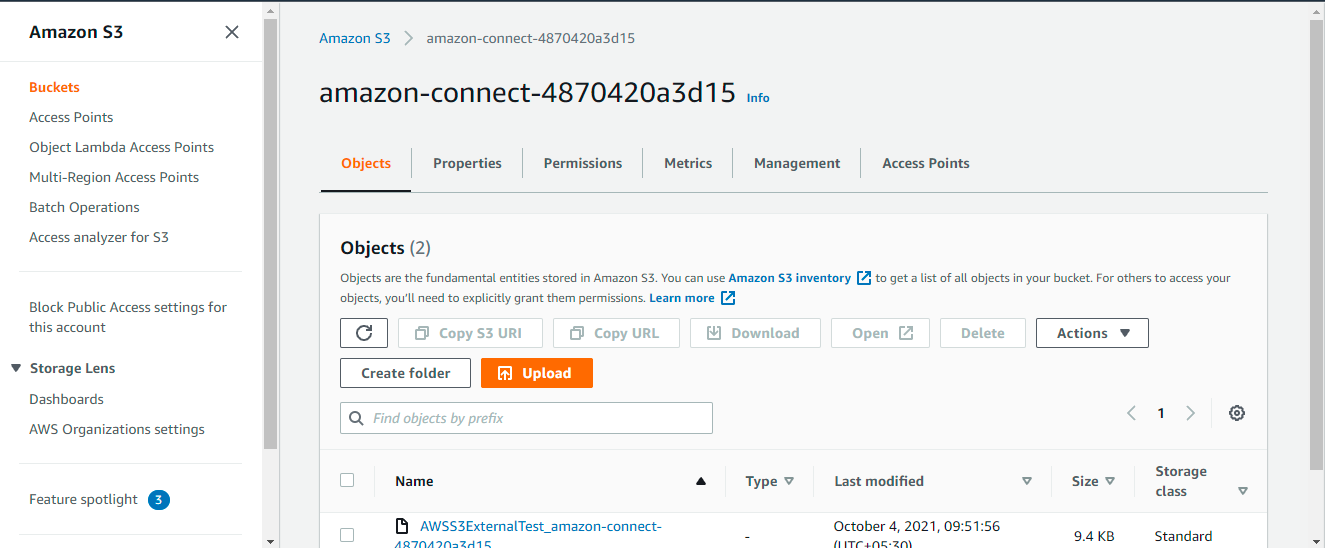
This will open Figure 3. By default, the Objects tab page will be open in Figure 3. Click on the Metrics tab page.
-
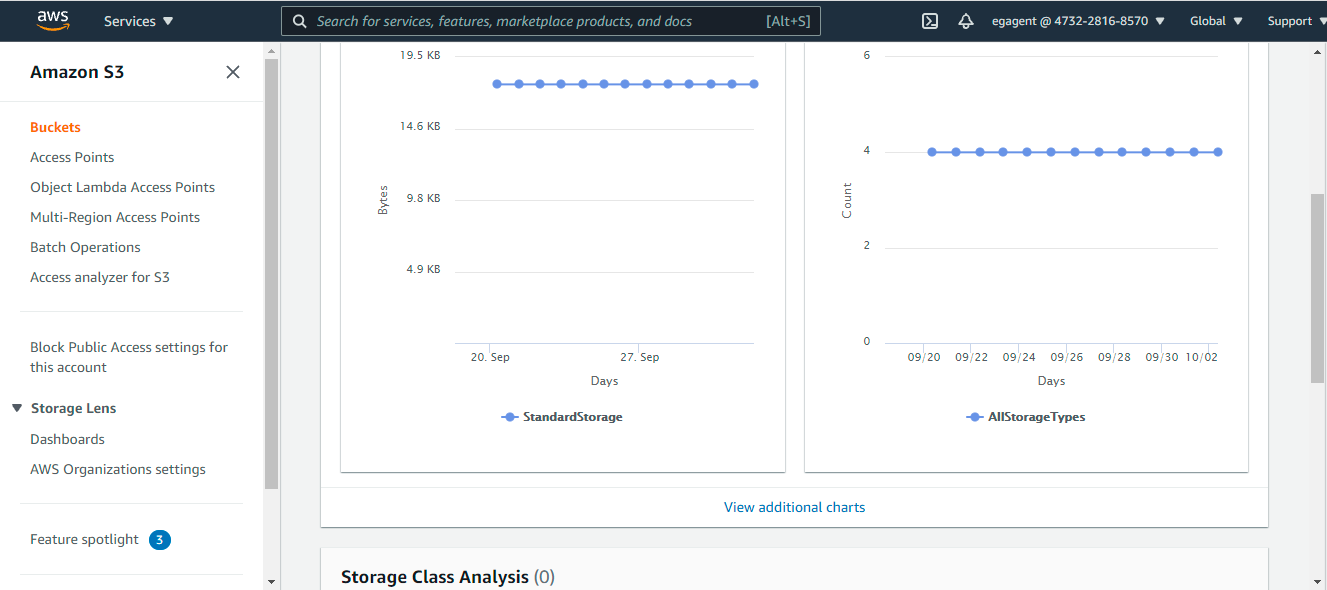
Figure 4 will then appear. Scroll down the left panel of Figure 4, until the View additional charts option under Bucket metrics becomes visible. Click on View additional charts.
-
Doing so will invoke Figure 5, with the Storage metrics tab page open by default. Now, click on the Request metrics tab page to open it.
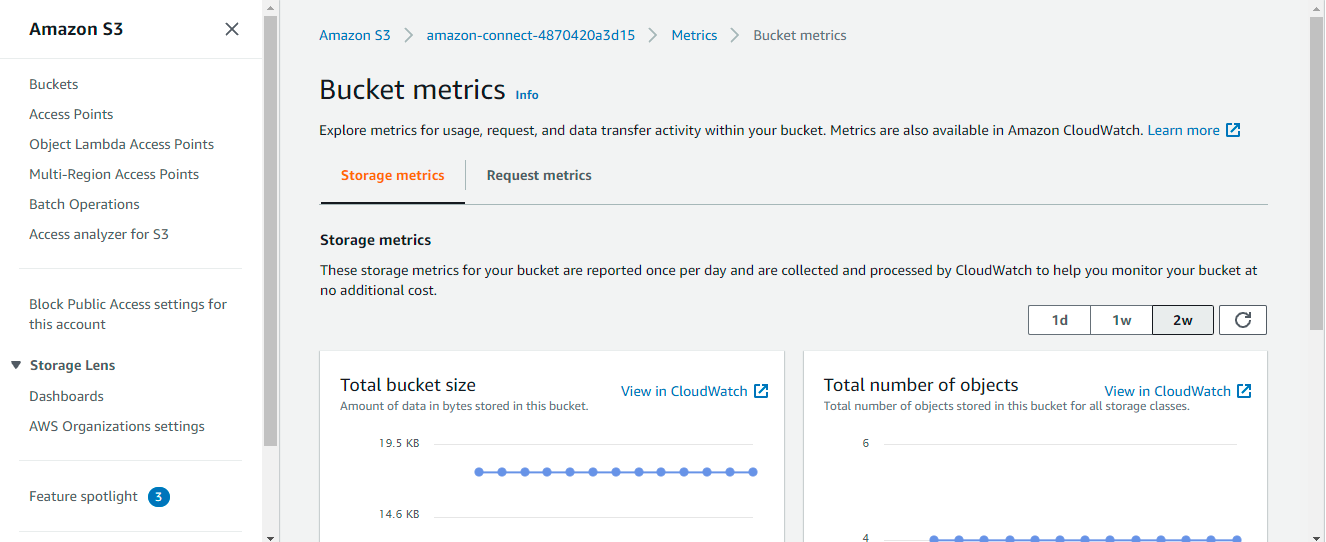
Figure 5 : The Storage metrics tab page of the Bucket metrics page
-
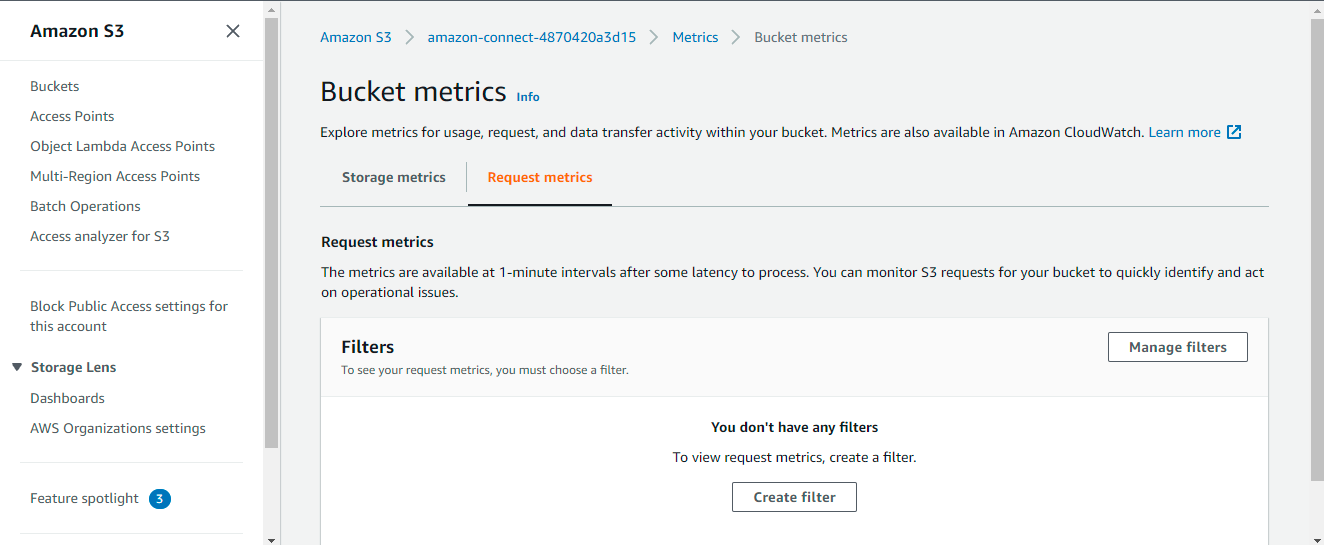
Figure 6 will then appear. Click the Create filter button in Figure 6 to create a new filter.
-
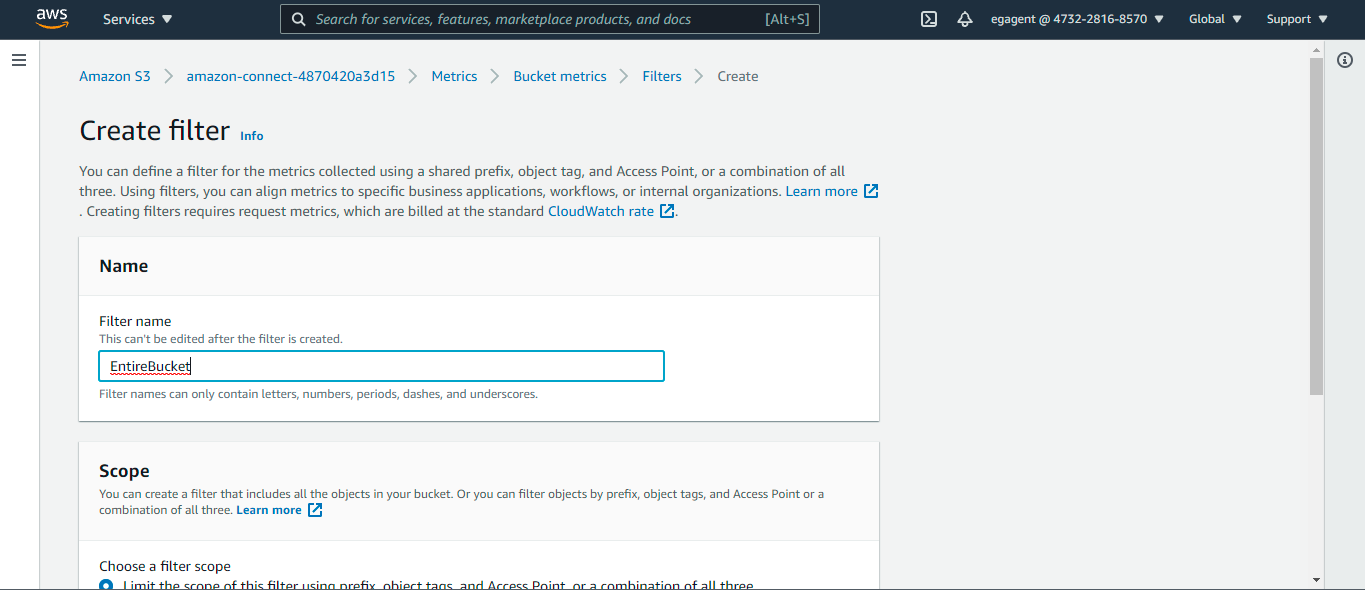
When Figure 7 appears, provide a name for the new filter in the Filter name text box. Names can only contain letters, numbers, periods, dashes, and underscores. We recommend using the name EntireBucket for a filter that applies to all objects.
-
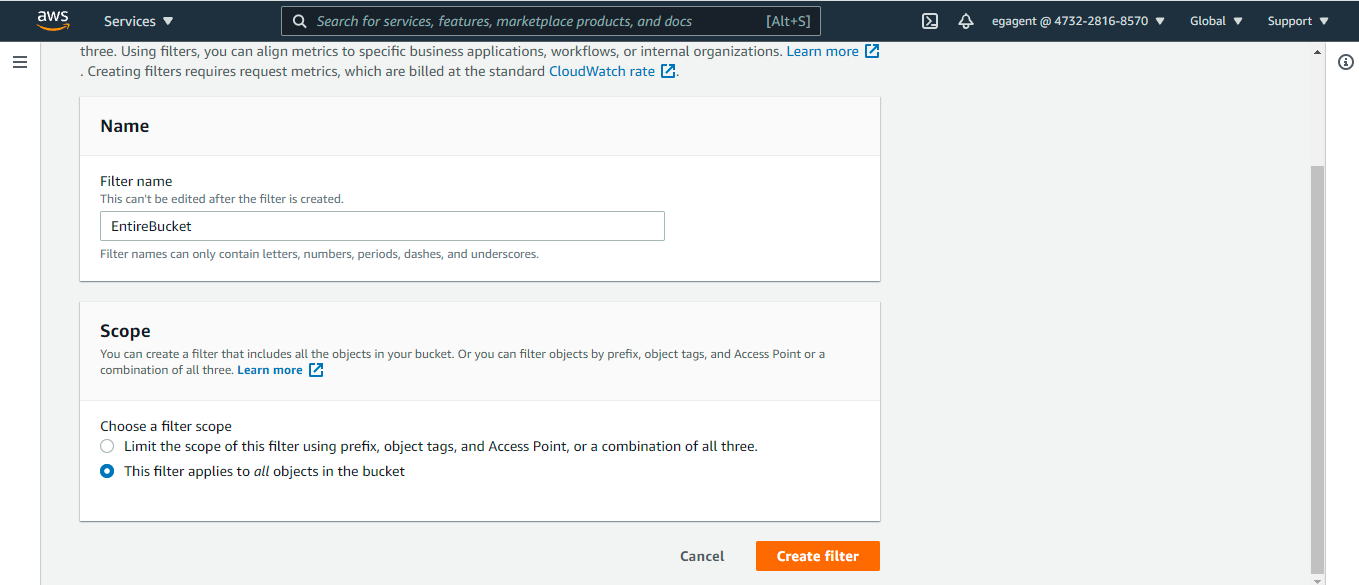
Then, scroll down Figure 7, so the Scope section comes into view (see Figure 8). From Choose a filter scope, select the This filter applies to all objects in the bucket option. You can also define a filter so that the metrics are only collected and reported on a subset of objects in the bucket. Finally, click the Create filter button in Figure 8.
-
Next, in the Request metrics tab, choose the filter that you just created from the Choose filters drop-down (see Figure 9).
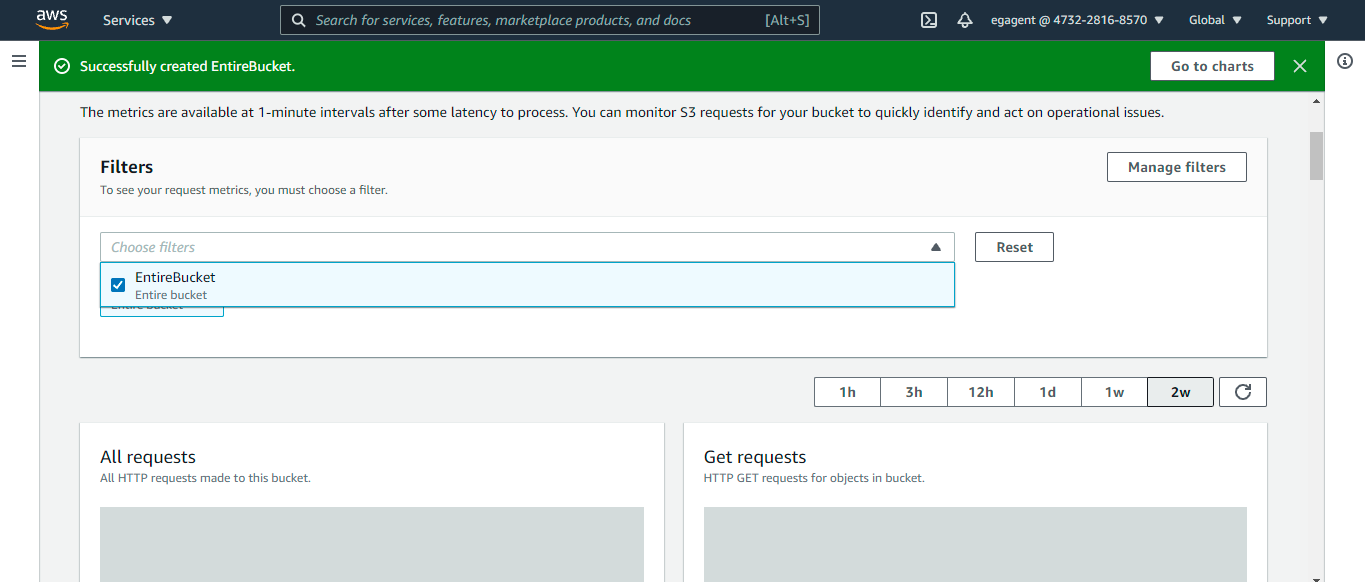
Figure 9 : Choosing the new filter from the Choose filters drop-down
-
Repeat steps 1-9 for every S3 bucket that you want to monitor.
After about 15 minutes, CloudWatch begins tracking these request metrics. You can see them in the Request metrics tab. You can see graphs for the metrics in the Amazon S3 or CloudWatch console. Request metrics are billed at the standard CloudWatch rate.