
Hyper-V Memory Test
This test reports how the Hyper-V host uses the physical memory resources available to it, and reveals whether adequate free memory is available on the host or not.
Target of the test : A Hyper-V server
Agent executing the test : An internal agent
Output of the test : One set of results for the Hyper-V host monitored
| Parameter | Description |
|---|---|
|
Test period |
This indicates how often should the test be executed. |
|
Host |
Specify the HOST for which this test is to be configured. |
|
Enable memory diagnosis |
|
|
Detailed Diagnosis |
To make diagnosis more efficient and accurate, the eG Enterprise embeds an optional detailed diagnostic capability. With this capability, the eG agents can be configured to run detailed, more elaborate tests as and when specific problems are detected. To enable the detailed diagnosis capability of this test for a particular server, choose the On option. To disable the capability, click on the Off option. The option to selectively enable/disable the detailed diagnosis capability will be available only if the following conditions are fulfilled:
|
| Measurements | Description | Measurement Unit | Interpretation |
|---|---|---|---|
|
Run queue length |
Indicates the instantaneous length of the queue in which threads are waiting for the processor cycle. This length does not include the threads that are currently being executed. |
Number |
A value consistently greater than 2 indicates that many processes could be simultaneously contending for the processor. |
|
Number of blocked processes |
Indicates the number of processes currently blocked for I/O, paging, etc. |
Number |
A high value could indicate an I/O problem on the host (e.g., a slow disk). |
|
Swap memory |
This measurement denotes the committed amount of virtual memory. This corresponds to the space reserved for virtual memory on disk paging file(s). |
MB |
An unusually high value for the swap usage can indicate a memory bottleneck. Check the memory utilization of individual processes to figure out the process(es) that has (have) maximum memory consumption and look to tune their memory usages and allocations accordingly. |
|
Free memory |
Indicates the free memory available currently. |
MB |
A very low value of free memory is also an indication of high memory utilization on a host. The detailed diagnosis of this measure lists the top 10 processes responsible for maximum memory consumption on the host. |
|
Scan rate |
Indicates the memory scan rate. |
Pages/Sec |
A high value is indicative of memory thrashing. Excessive thrashing can be detrimental to application performance. |
The detailed diagnosis of the Free memory measure lists the top-10 memory-consuming processes on the Hyper-V host. Using this information, you can accurately identify the process that is causing the memory drain on the host.
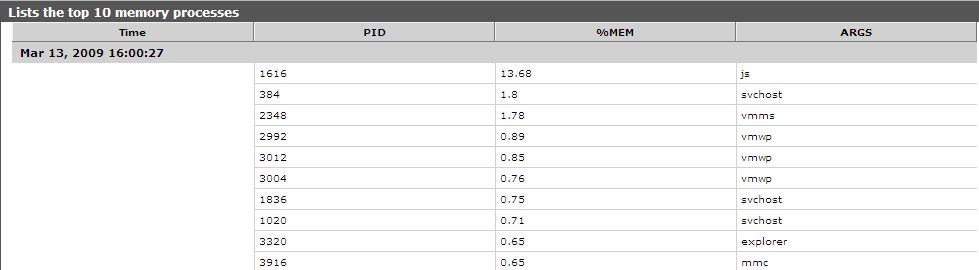
Figure 12 : The top 10 memory consumers on the Hyper-V host
