
The Hyper-V Monitoring Model
eG Enterprise prescribes a specialized Hyper-V model (see Figure 10) for monitoring Microsoft Hyper-V servers with VMs that host server applications.
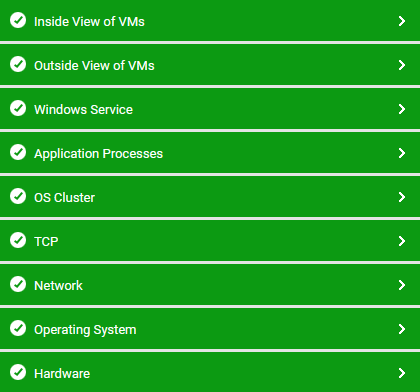
Figure 10 : The layer model of the Hyper-V server
Each layer of Figure 10 execute tests that report on key performance parameters pertaining to the Hyper-V server. Using these metrics, administrators can find quick and accurate answers for the following questions:
-
Are adequate memory and disk resources available on the Hyper-V host operating system?
-
Which logical processor is being used excessively? Who is making more use of the CPU resources – the VMs or the hypervisor?
-
How many virtual processors does the hypervisor support? How many of these are available to the root partition? Are all processors used optimally, or have abnormal usage trends been detected with any processor? Which one is it? What is eroding the CPU resources - the guest code or hypervisor code?
-
How many memory pages have been deposited with the root partition?
-
Do too many TLB flushes occur on the root partition?
-
Are too many TLB large pages been used by the root partition?
-
How frequently has the root partition attempted to access a page that is not in the CPU TLB?
-
How busy is the root partition? Are hypercalls issued by or instructions completed on the root partition very frequently?
-
Is the hypervisor managing memory resources efficiently?
-
Is the VMBus able to process interrupts smoothly?
-
Which is the busiest network adapter/switch/switch port on the Hyper-V server, in terms of amount of network traffic handled?
-
Are all critical Hyper-V processes/services available?
-
How are the VMs using each virtual processor assigned them? Is any VM over-utilizing the virtual processors?
-
Is any VM currently powered off?
-
How many VMs are registered with the Hyper-V servers?
-
How much physical memory and disk resources have been allocated to every VM? Which VM has been allocated the maximum memory, CPU, and disk resources?
-
Are the network adapters supported by the VM healthy or is too much data being lost on the network adapters?
-
Which is the busiest VM on the Hyper-V server, in terms of hypercalls and instructions issued/completed?
-
Were any VMs migrated to/from the server? If so, which ones are they, and why were they migrated?
-
Are any VMs being deleted on the server?
-
Are all VMs currently running, or has any VM been paused for a short while?
-
Is any VM inaccessible to users?
-
How are the VMs using the allocated resources?
-
Is any VM currently experiencing a resource crunch? Are any resource-intensive applications/processes executing on that VM?
The layers depicted by Figure 10 and the tests mapped to each are discussed elaborately in the sections to come.
To zoom into each layer depicted by Figure 10 and the tests mapped to it, click on the layer links below.
