
The Inside View of VMs Layer
The Outside View of VMs layer provides an “external” view of the different VM guests – the metrics reported at this layer are based on what the Hyper-V host is seeing about the performance of the individual guests. However, an external view of the VM guest operating system and its applications may not be sufficient. For instance, suppose one of the disk partitions of the guest operating system has reached capacity. This information cannot be gleaned from host operating system. Likewise, bottlenecks such as a longer process run queue or a higher disk queue length are more visible using an internal monitor. Internal monitoring (from within the guest operating system) also provides details about the resource utilization of different application(s) or processes.
The tests mapped to the Inside View of VMs layer provide an "internal" view of the workings of each of the guests - these tests execute on an Hyper-V host, but send probes into each of the guest operating systems to analyze how well each guest utilizes the resources that are allocated to it, and how well it handles user sessions, TCP traffic, and network loading.
By default however, clicking on the Inside View of VMs layer, does not display the list of tests associated with that layer. Instead, Figure 1 appears, which provides you with an overview of individual guest performance (see Figure 1).
Figure 1 : A list of guest operating systems on a Hyper-V host and their current state
To return to the layer model of the Hyper-V server and view the tests associated with the Virtual Servers layer, click on the component layers link in Figure 1. You can now view the list of tests mapped to the Inside View of VMs layer, as depicted by Figure 2 below.
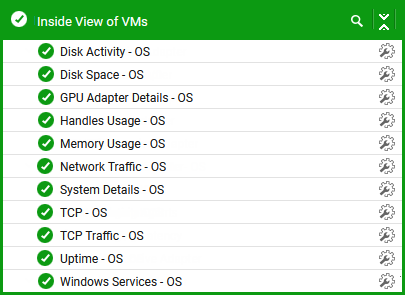
Figure 2 : The tests mapped to the Inside View of VMs layer
If you want to override this default setting - i.e., if you prefer to view the tests mapped to the Inside View of VMs layer first, and then proceed to focus on individual guest performance, follow the steps given below:
-
Edit the eg_ui.ini file in the <eg_install_dir>\manager\config directory
-
Set the LAYERMODEL_LINK_TO_VIRTUAL flag in the file to false; this is set to true by default.
-
Save the eg_ui.ini file.
Doing so ensures that as soon as the Inside View of VMs layer is clicked, the list of tests mapped to that layer appears, as depicted by Figure 3.
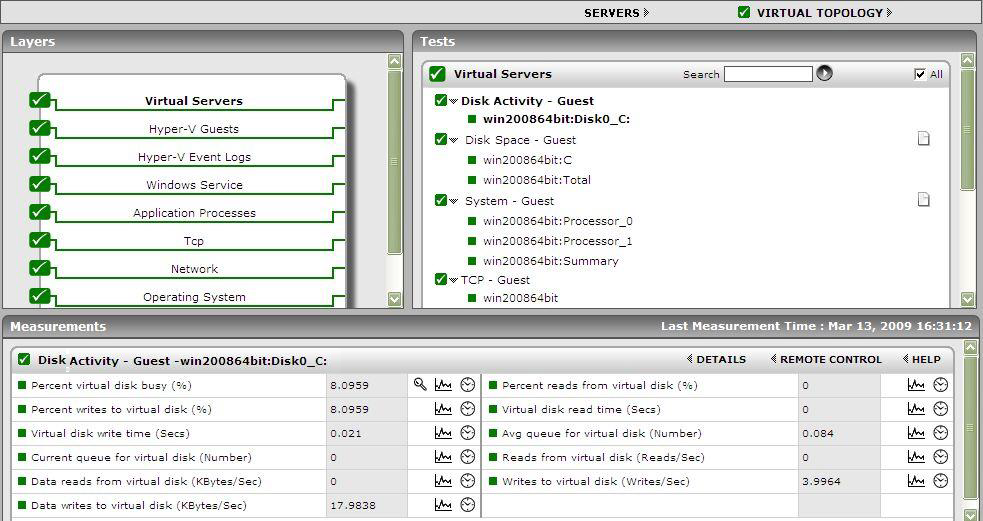
Figure 3 : The tests mapped to the Virtual Servers layer
If you now want the Server view of Figure 1, simply click on the servers link above the list of tests in Figure 3 (indicated by the arrow).
Clicking on any of the guests in the Server view leads you to Figure 4 that displays all the performance metrics extracted from that guest, in real-time. You are thus enabled to cross-correlate across the various metrics, and quickly detect the root-cause of current/probable disturbances to the internal health of a guest. To view the time-of-day variations in a measure, you can view its graph by clicking on that measure in Figure 4.
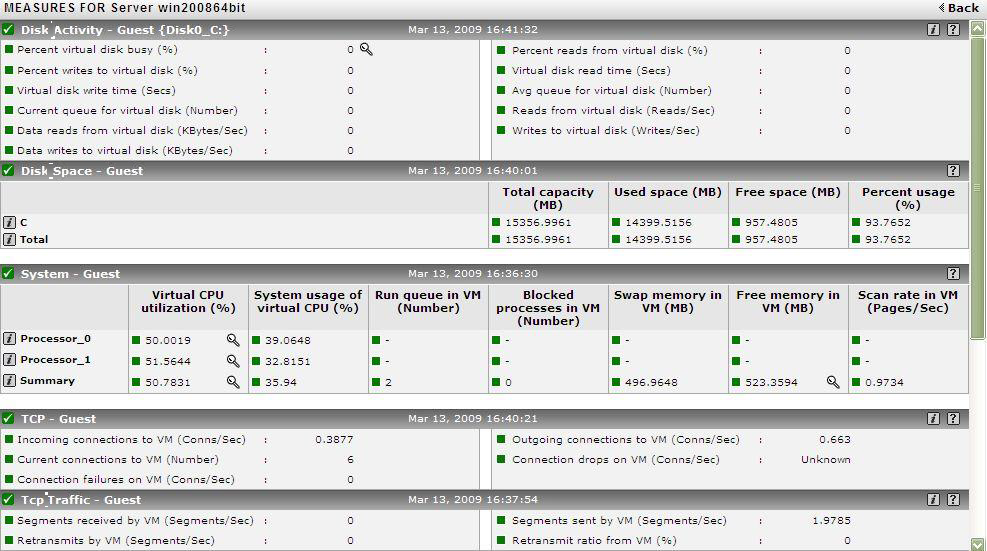
Figure 4 : Measures pertaining to a chosen guest
To view real-time graphs of pre-configured measures (pertaining to the Hyper-V host and the guests operating on it), click on the live graph link in Figure 1. Alternatively, you can click on the  icon that appears in the Tests panel (see Figure 1) when the Outside View of VMs layer is clicked. The graph display that appears subsequently (see Figure 5) has been organized in such a way that next to every host-pertinent measure graph, the closely related guest-specific measure graph appears. For instance, next to the graph of the 'Cpu utilization' measure of the Hyper-V Logical Processors test, you will find a graph of the 'Virtual machine cpu utilization’ measure of the Hyper-V Guests test. This way, you can easily compare and correlate how well the physical CPU resources are being utilized by both the Hyper-V host and the guests. On the basis of this analysis, you can proactively isolate potential performance issues, and also determine the root-cause of the issue - is it the Hyper-V host? or is it the virtual guest? If you access this page from the LIVE GRAPH link in Figure 1, then, by default, you will view live graphs pertaining to the Hyper-V server. However, you can select a different virtualized component-type and a different virtualized component using the type and Component Name lists (respectively) in Figure 5.
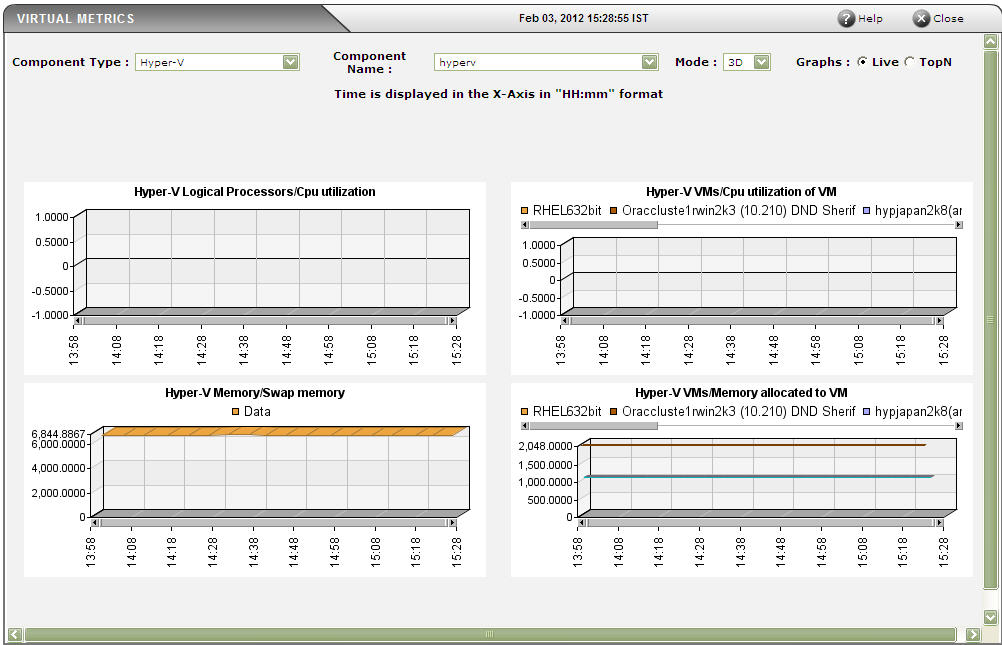
Figure 5 : Live graph comparing physical resource usage of a Hyper-V server (on the left) and resource usage levels of the individual VMs (on the right )
As indicated in Figure 2, the tests associated with this layer monitor different aspects of each virtual guest. Disk space utilization, disk activity levels, CPU utilization, memory usage levels, network traffic, etc. are all monitored and reported for each virtual guest hosted on the Hyper-V server. Detailed diagnosis for these tests provide details of individual processes and their utilization levels.
