Acknowledgement History
eG Enterprise stores and displays all the acknowledgement descriptions that are associated with a particular alarm, so that the help desk staff can consult with each other online, exchange views, and thus arrive at effective solutions to persistent performance issues with target components. The eG monitoring interface presents this acknowledgement history to you in various ways. While the current alarms window provides you with the complete acknowledgement history of a current issue, the event history page leads you to all acknowledgements associated with a problem that occurred in the recent/distant past.
Sometimes however, to perform better problem diagnosis, you might want to review specific acknowledgment descriptions associated with an alarm and not all of them. For instance, while two users - john and elvis - may have acknowledged an alarm raised on an Oracle database server, you might only want to view user john’s acknowledgement description. To facilitate such selective viewing of acknowledgement information, eG Enterprise provides a dedicated acknowledgement history page; this page provides a wide variety of filter options with the help of which you can quickly and easily run a search across all alarm acknowledgements, and swiftly locate the acknowledgment information of interest to you.
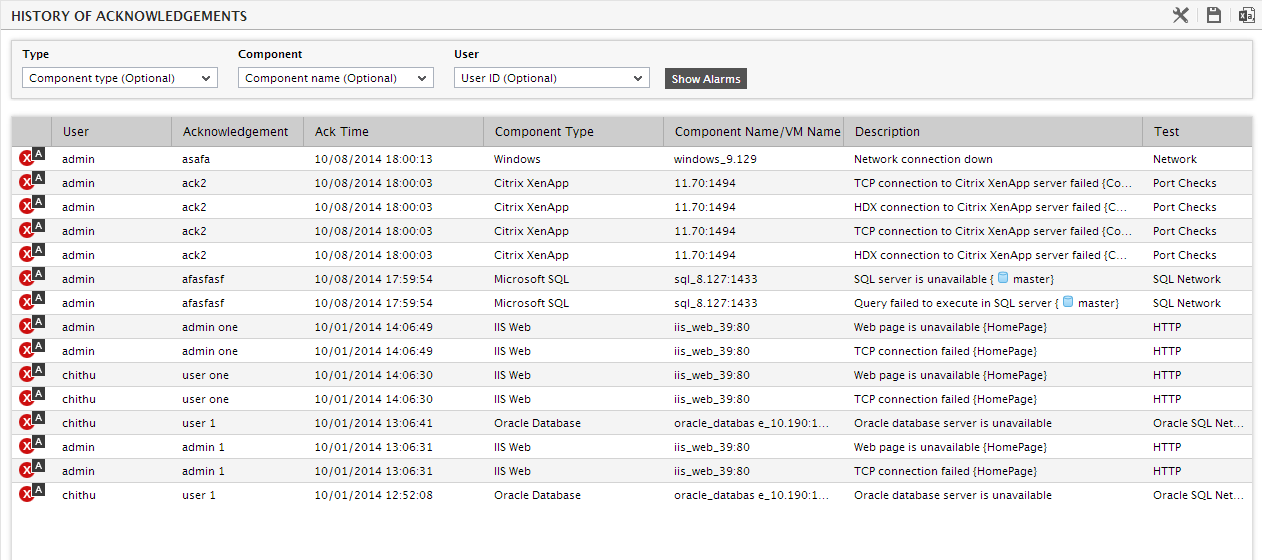
Figure 1 : Viewing the history of alarm acknowledgements in the ACKNOWLEDGEMENT HISTORY page
To access the acknowledgement history page, click the History of Acknowledgements in the Alarms tile. When Figure 1 appears, you can use any of the filter options discussed below to quickly retrieve the acknowledgement information that you are looking for.
- To view all alarm acknowledgements related to a particular component type, pick a Type from the list box in Figure 1.
- To view all the acknowledgements associated with a particular component, select an option from the Component list in Figure 1.
- If you want to view all the acknowledgements submitted by a particular user, then pick an option from the User list.
- By default, the acknowledgement history page provides the details of all the acknowledgements that were submitted during the last 24 hours. Accordingly, the Timeline is set to 24 hours by default. If need be, you can change this Timeline, so that the page displays only those acknowledgements that were submitted during the specified timeline.
- By default, the acknowledgement history page displays all acknowledgements that were submitted for all types of alarms, regardless of the problem status. Accordingly, the Alarm Type is set to All by default. However, if you want to view only those acknowledgements that pertain to the open alarms, pick the Open option from the Alarm Type list. Similarly, you can pick the Closed option from this list to view the acknowledgement information that related to closed issues only.
- You can even indicate how many acknowledgement records need to be provided per page by picking an option from the Records per page list.
- Finally, click on the Show Details button.
- The resulting report then provides the acknowledgement history that fulfills the specified conditions (see Figure 1).
While you can save the report as a CSV file by clicking on the
 icon in
Figure 1, you can save the same as a PDF document by clicking on the
icon in
Figure 1, you can save the same as a PDF document by clicking on the  icon.
icon.