Associating Metrics with the Components in a Tier
Next, proceed to associate every component in the tier with performance metrics. To do so, click on the [Add metric] link in Figure 1.
-
Figure 1 will then appear wherein the details of the measurement will have to be specified.
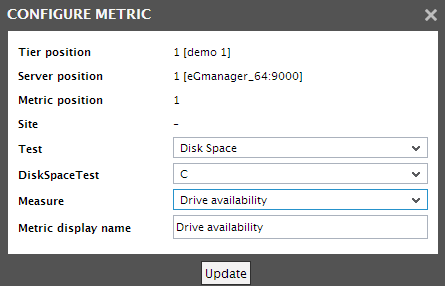
- If the measurement to be added pertains to a particular site, select the Site.
- Select a Test, and if the test takes descriptors, pick a Descriptor.
- Then, select a Measure, and provide a display name for the measure in the Metric name text box.
- Finally, click the Update button.
-
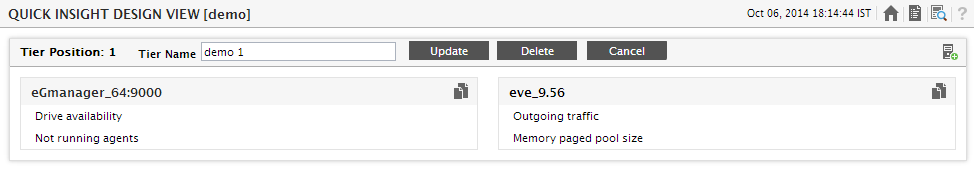
The newly added measure will now appear in the design view (see Figure 2).
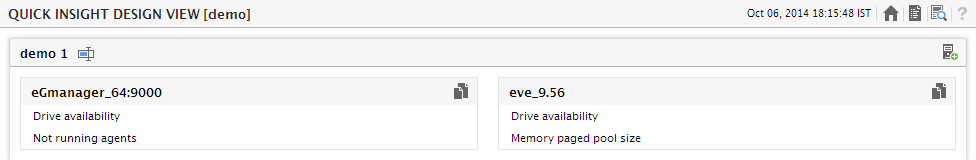
- Similarly, multiple measures can be associated with a single component (see Figure 3).
-
If the measures configured for one component in a tier need to be associated with a few / all the other components in the tier, then, click on the
 icon next to the server name (for which at least one measure has been configured) in Figure 2. Figure 3 will then appear. The Available metrics list in Figure 3 will display the measures that have been configured for the displayed Server name. From this list, select the measures to be copied to the other components in the tier. Then, from the Available servers list that lists all the other components in the tier, select those components to which the chosen measures need to be copied. Finally, click the update button in Figure 4.
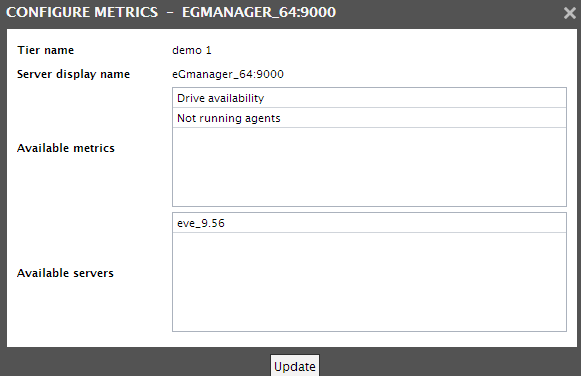
Figure 3 : Applying measures to a few / all the other components in a tier
-
The changes will be reflected in the design view as depicted by Figure 3.
- Similarly, measures can be associated with the components in all other tiers of the custom view.
-
Once the layout is designed, begin monitoring the behavior of the associated metrics by clicking the
 icon at the right top corner of Figure 4
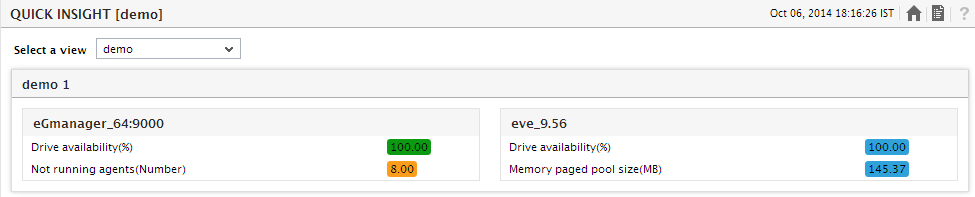
- eG will then begin displaying the measure values in the custom view that was designed (see Figure 5). The measures will get updated based on the Refresh Rate set using Figure 5. While the normal measure values will be displayed in green, the critical values will appear in red, major ones in orange, minor values in yellow, and unknown values in blue.
- The Drive Availability measure of the eGmanager server in Figure 5 displays 100, indicating the non-availability of the web server. To know more about this issue, click on the Drive Availability measure in Figure 5.
- Figure 5 will appear displaying the layer model of the eGmanager web server indicating the exact layer of the problem, the tests that detected the problem, and the measures that were rendered abnormal.