Components Tab Page
If issues at the application-level are hindering segment performance, you can promptly isolate such issues and the segment components affected by them using the Components tab page (see Figure 1).
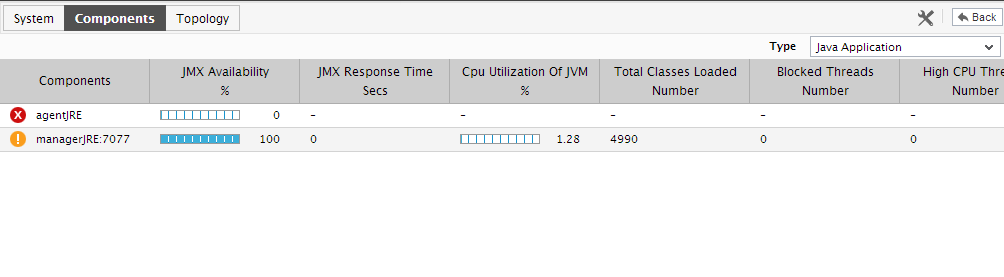
Figure 1 : The Components tab page of the Segment dashboard
By default, in the Components tab page for a particular segment, you will find pre-configured application-level metrics pulled out of that segment component which is currently experiencing problems of the highest priority. This is why, the component type to which such a component belongs is chosen by default from the Type list in the Components tab page. If need be, you can pick a different Type from this list to view the current state of all segment components of that type.
You can even override the default measure list for a component type by configuring additional application-level metrics to be displayed in the Components tab page or by removing one/more metrics that pre-exist. For this, click on the  icon at the right, top corner of Figure 2. Figure 2 will appear.
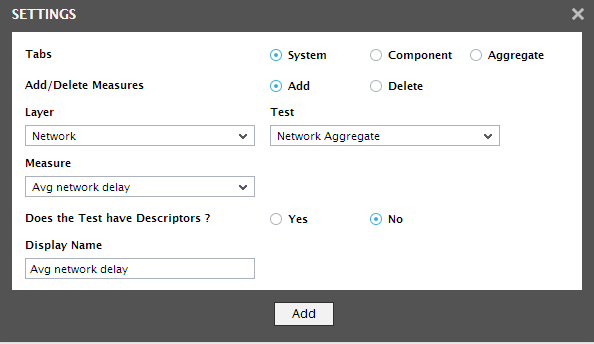
Figure 2 : Adding a new measure to the Components tab page of the Segment dashboard
To add a measure to the Components tab page using Figure 2, do the following:
- Select the Components option from the Tabs section.
- Set the Add/Delete Measures flag to Add.
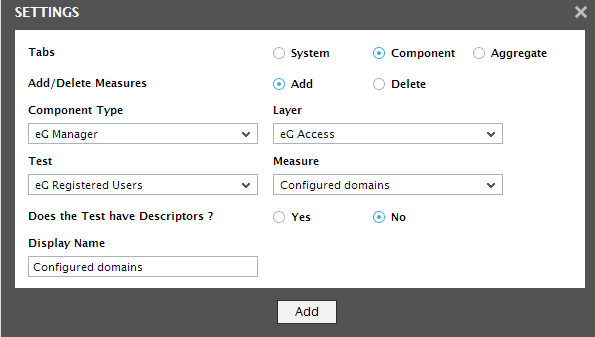
- Pick a Component Type from the list of component types that are part of all the fully-configured segments in your environment.
- The Layer list will then be populated with all the application-level layers related to all segment components. Pick the Layer that reports the measure of interest to you,
- This will populate the Test list with all the tests that execute on the chosen Layer. Select the Test that reports the measure you need.
- Then, choose the Measure to be added and provide a Display Name for the measure.
- Finally, click the add button to add the chosen measure to the Systems tab page.
To delete a measure from the Systems tab page using Figure 2, do the following:
- Select the Components option from the Tabs section.
- Set the Add/Delete Measures flag to Delete.
-
Pick a Component Type from the list of component types that are part of all the fully-configured segments in your environment (see Figure 3).
- From the Test list. Select the Test that reports the measure you need.
- Choose the Measure to be deleted. The Display Name of the selected measure will then be automatically displayed.
- Click the delete button to delete the measure.
By default, the contents of the Components tab page are sorted based on the state of the segment components listed therein. If more that one component of a chosen Type exists in the same state, then the components of that state will be sorted in alphabetical order. If need be, you can change the sort order. For example, if you wish to sort the components listed in the Components tab page in the descending order of the values of their Response time, just click on the Response time label. Doing so, tags the Response time label with a down arrow icon – this icon indicates that the Components tab page is currently sorted in the descending order of the responsiveness of each component. To change the sort order to ‘ascending’, all you need to do is just click again on the Response time label or the down arrow icon. Similarly, you can sort the Components tab page based on any column available in the table.
Click on any segment component in the Components tab page to view the layer model of that component.
Note:
- Only a user who is assigned the Admin role is allowed to customize the segment dashboard by clicking on the icon.
- While displaying values for descriptor-based measures in the Components tab page, the eG Enterprise system does not display the actual values per descriptor. Instead, the solution computes the average or the total sum of values across descriptors and displays it in the corresponding measure column. For instance, for values reported as percentages, the solution computes the average value across descriptors. On the other hand, if the value is reported as a GB or MB, then the total sum of all the descriptor values of the component will be displayed against the component.