Daily Performance Overview Report Emailer
eG Enterprise is now capable of sending a user-wise report on a daily basis as an email for a set of key performance metrics of the servers assigned to each user in the target environment. The generated report can be compared on the fly with the report generated for the previous day. This report helps administrators in understanding the overall health of the target environment without having to view the dashboards.
Pre-Requisites
-
The Mail Alert Settings should be configured for the user to whom the report is to be sent as an email in the eG administrative interface.
Note:
To know how to configure the mail alerts settings for a user, refer to the Administering Using eG Enterprise document.
Configuring the Daily Performance Overview Report Emailer
The Daily Report Emailer can be configured based on the needs of the user as well as based on the component types monitored in the target environment. To configure the Daily Report Emailer, first, you need to click on the Edit Profile link that appears in the USER PROFILE drop-down window when the  icon is clicked (see Figure 1).
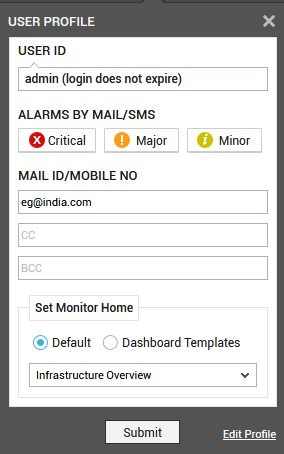
Figure 1 : The USER PROFILE drop-down window
In Figure 2 that appears, click the Configure Daily Emailer button.
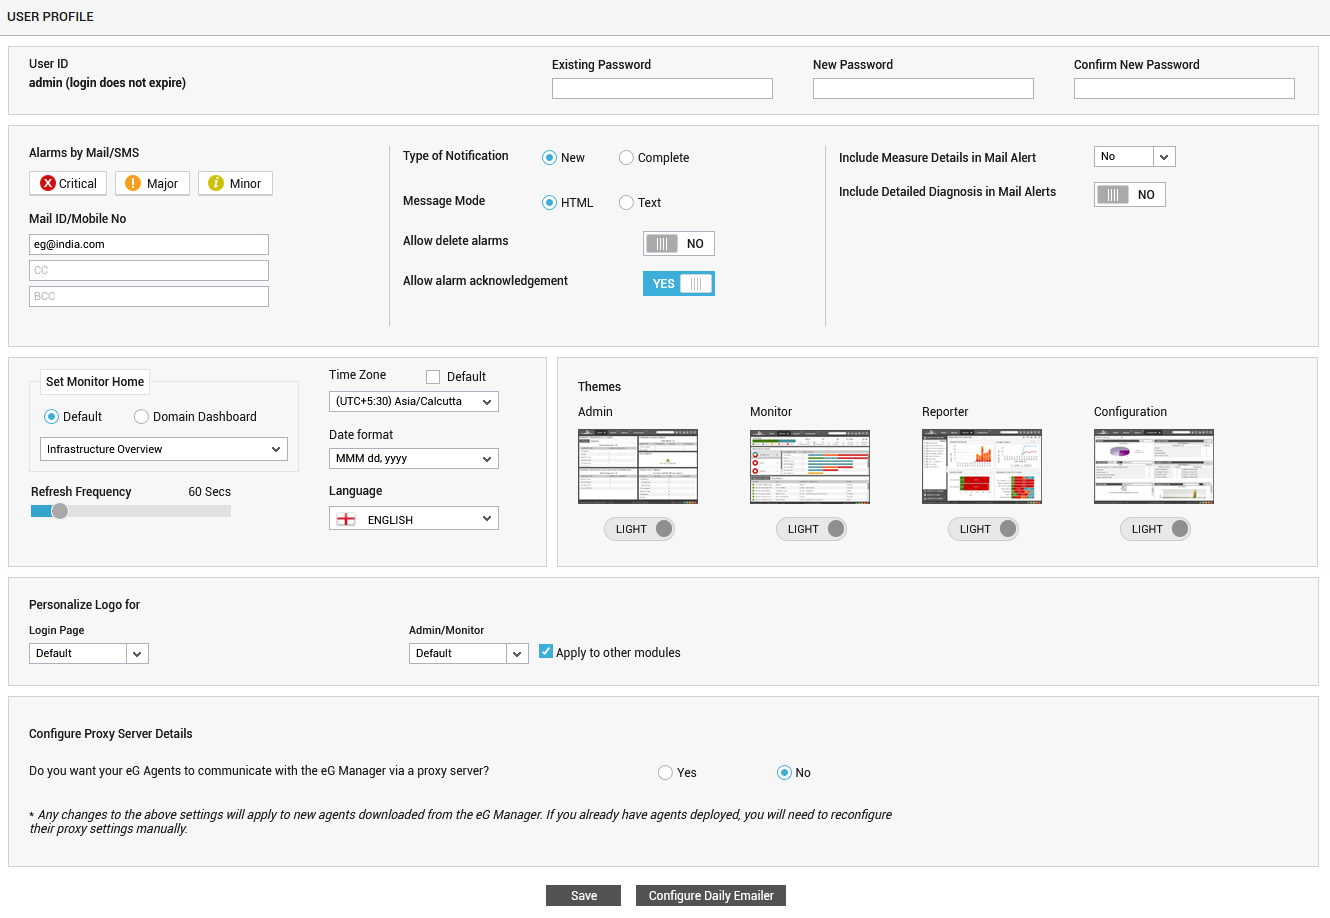
Figure 2 : The USER PROFILE page
Figure 3 will then appear where you need to provide the basic details to generate the Daily Performance Overview Report Emailer.
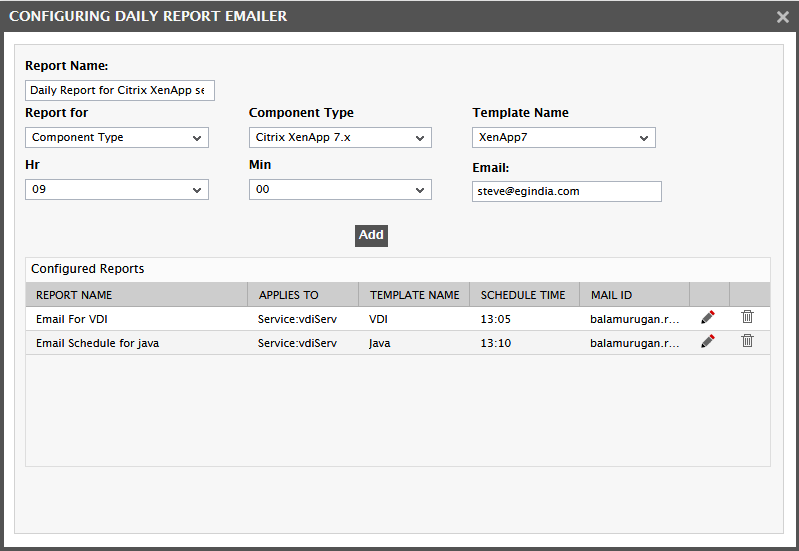
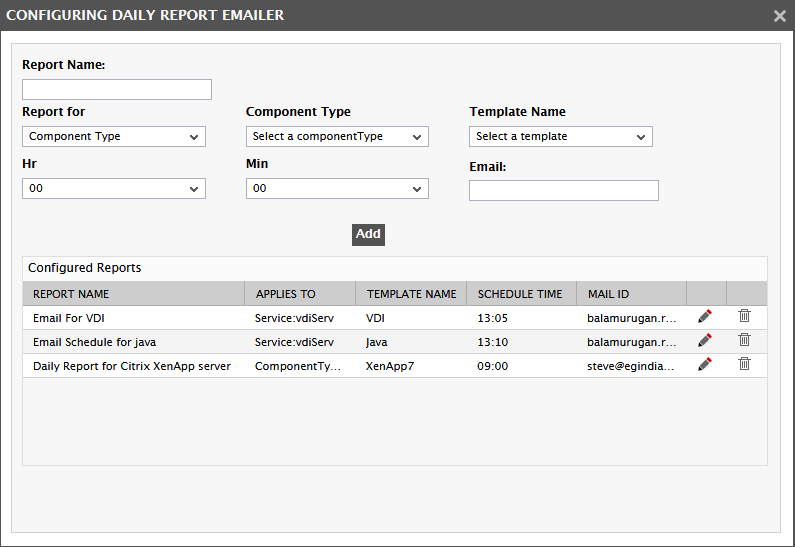
Figure 3 : Configuring a Daily Performance Overview Report Emailer
Specify the following in Figure 3:
- Specify the name of the report in the Report Name text box.
- Select an option from the Report for list for which the report is to be generated and emailed to. By default, Component Type option is chosen from this list. Note that this list box will list only the Service/Segment/Component Type/Zone/Components associated with the user to whom the report is to be emailed. Select a Component Type for which the report is to be generated.
- If the Service option is chosen from the Report for list, then an additional Service list box will appear listing all the services associated with the user. Picking a service from this list will list all the associated component types in the Component Type list. Select a Component Type for which the report is to be generated.
- If the Segment option is chosen from the Report for list, then, an additional Segment list box will appear listing all the segment associated with the user. Picking a segment from this list will list all the associated component types in the Component Type list. Select a Component Type for which the report is to be generated.
-
If the Zone option is chosen, then an additional Zone list box will appear listing all the zones in which the user operates. If a Zone contains subzones, then, if you want to include the subzones of the chosen Zone, you need to set the Include SubZones flag to Yes. Picking a zone from this list will list all the associated component types in the Component Type list. Select a Component Type for which the report is to be generated.
-
Once a Component Type is chosen, the template associated with it is automatically populated in the Template Name list. By default, a set of pre-defined templates are provided by eG Enterprise. These templates are auto-associated to a set of Component Types. If the component type you have chosen is not associated with a template, then, you will get a message to that effect will appear as shown in Figure 4. If you wish to define a new template, then, please contact support@eginnovations.com
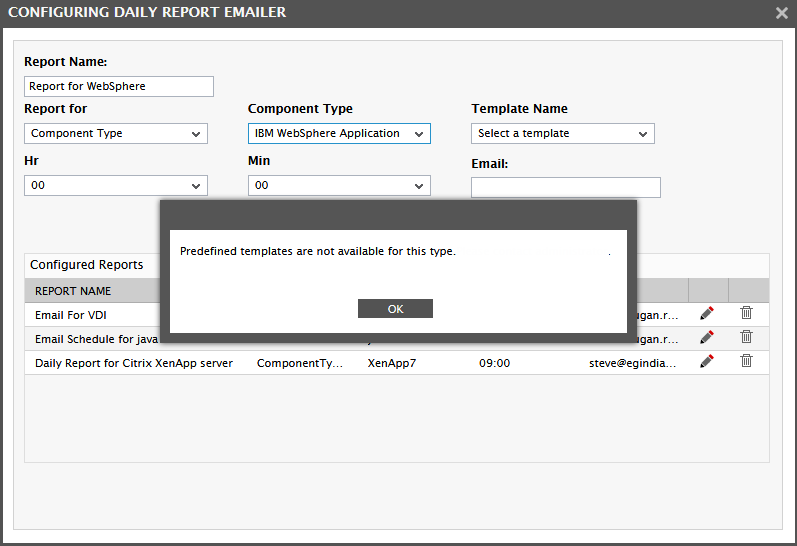
Figure 4 : A message stating that a pre-defined template is not available for the chosen Component Type
- Using the Hr and Min lists, specify the exact time at which the report is to be generated and emailed to the user.
- Specify the email id of the user to which the report is to be generated and emailed in the Email text box.
-
Clicking the Add button will append you selection to the Configured Reports section as shown in .
- Clicking the
 icon in Figure 5 will help you to modify your selection.
 - To delete a configured Daily Performance Overview Report Emailer, click the
 icon in Figure 5.
The Generated Daily Performance Overview Report Emailer
Once the Daily Performance Overview Report Emailer is configured, a daily report as shown in Figure 6 will be sent via email to the configured user from the next day of configuring the report in Figure 5.
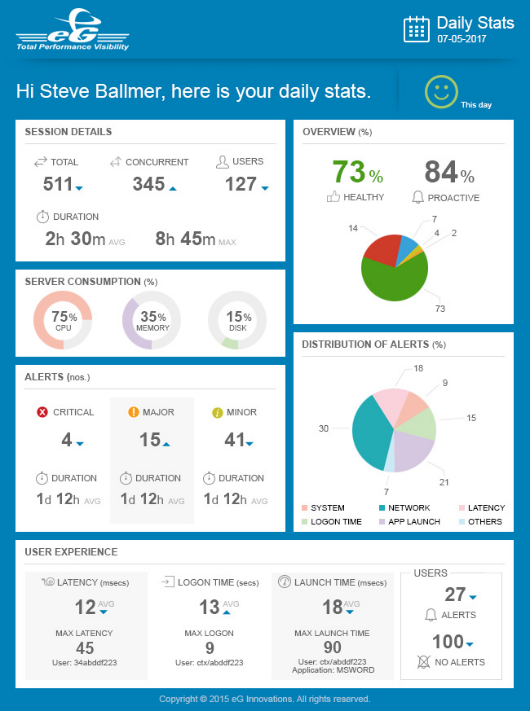
Figure 6 : The Daily Performance Overview Report Emailer
Note that the comparative analysis of the problems in the target environment is only from Day 2 of the generating and emailing the Daily Performance Overview Report Emailer. Figure 7 illustrates a Daily Performance Overview Report Emailer generated with a comparison. By default, only an increase/decrease in the problems generated in the target environment is shown as part of the comparative analysis. This is generally done using the up or down arrow against each value specified in the panels of the Daily Performance Overview Report Emailer.
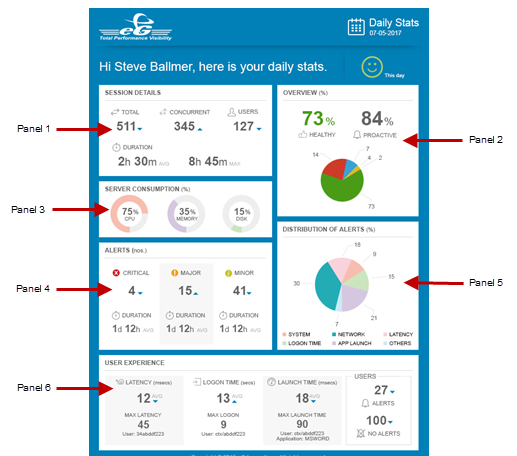
Figure 7 : The Daily Performance Overview Report Emailer with comparison to the report of the previous day
The Daily Performance Overview Report Emailer consists of 6 different panels as shown in Figure 7. Let us now discuss each panel in detail:
Panel 1: This panel provides the overall session details of the virtual environment in which the components are associated with the eG user.
Panel 2: This panel provides an overview of the percentage of alerts that were solved by the eG Enterprise during the last day. This percentage of alerts are deemed as Healthy in this panel. A Proactive alert percentage in this panel displays the percentage of alerts on which state transition was detected by the eG Enterprise during the last day.
Note:
- Proactive % is calculated based on the number of alerts that moved to a higher state i.e., a minor alert transit to a major alert and a major alert transit to a critical alert from the total alerts.
- If there is no transition to higher state and alerts are closed in the state that were originally reported, the Proactive % will be 100%.
Panel 3: This panel shows the utilization of the server on which the components that are monitored are hosted.
Panel 4: This panel provides an overview of the alerts detected by the eG Enterprise in the last day. By default, multiple alarms of a severity (Critical/Major/minor) generated for the same component are combined and stored in the eG backend database as a single entity. This panel provides the count of such entities against each severity. For instance, two different problems encountered by the VMware vSphere VDI component in the same layer and severity are grouped together and the count of the severity is reported as 1.
Alternately, the CURRENT ALARMS window and the HISTORY OF ALARMS page will show each problem as a separate alert as against the view displayed in this panel. If you want the CURRENT ALARMS window and the HISTORY OF ALARMS page too to show a combined view of the alerts of the same layer and severity, then, set the ShowEventHistory flag in the [ALARM_HISTORY] section of the <eG_INSTALL_DIR>\manager\config\eg_ui.ini file to No. This will include a + symbol as shown in Figure 8.

Figure 8 : The combined alarms of the same severity and layer
Expanding the + symbol in Figure will lead you to Figure 9 where individual problems can be viewed.

Figure 9 : Expanding the alarm to view the individual problems
Panel 5: By default, a pie chart displaying the distribution of alerts generated for the components associated with the chosen eG user is provided in this panel. For each layer of the component type to which the components are associated, the pie chart displays the distribution of alerts.
Some users may not want the distribution of alerts based on the layers of the component type. For such users, eG Enterprise provides an alternate in the form of a tier-wise health report. If the users want to view the tier wise health and alerts of each component associated with the user, then he/she can remove the Panel_5 entry against the WidgetsBasedonEmailType parameter. The Daily Report Emailer will then be generated as shown in Figure 10:
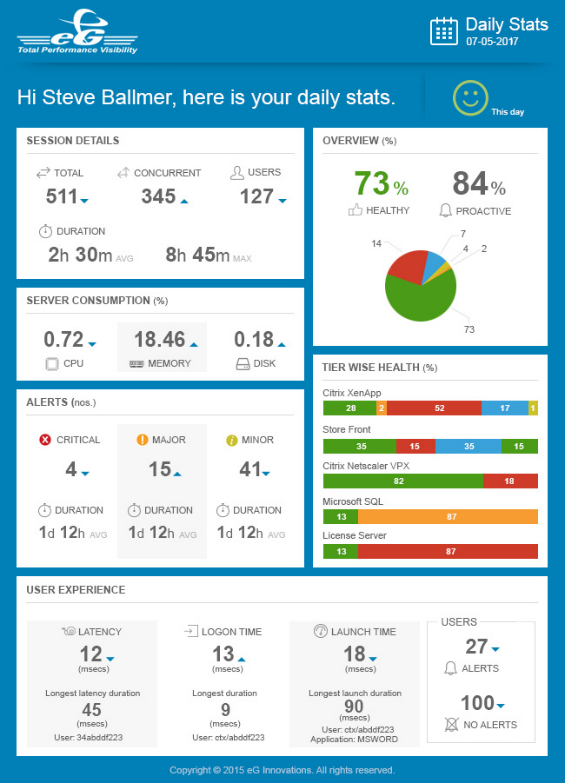
Figure 10 : Tier wise health displayed in Panel 5
Panel 6: This panel provides the experience of the users logged into the virtual environment associated with the eG user to whom the Daily Performance Overview Report Emailer is to be emailed.