Detailed Diagnosis
In order to view the detailed measures for a particular component, the supermonitor will have to select the Detailed Diagnosis option from the Options menu of the eG monitor interface.
Note:
Users will be able to view the detailed measures only if the eG license enables the detailed diagnosis capability of the eG Enterprise system.
In the page that follows, specify the following information (see Figure 1):
- Service: Select the service for which detailed measures are required. This is an optional field.
- Component: Select the component for which detailed measures need to be viewed. If there are too many components in the list to choose from, you can narrow your search further by using the Search text box. Specify the whole/part of the component name/type to search for in this text box, and click the right-arrow button next to it. The Component list will then be populated with all component names and/or component types that embed the specified search string. Select the component of your choice from this list.
- Layer: Choose the specific layer to which the measure requiring a detailed diagnosis is associated.
- Test: From this drop-down list box, pick the test that generates the detailed measures.
- Measure: From this drop-down list box, select the measurement for which a detailed diagnosis is required. The measures listed in this list box are the ones for which the corresponding test provides a detailed diagnosis.
- Timeline: The period for which the detailed diagnosis has to be analyzed can be specified using the Timeline list. You can either provide a fixed time line such as 1 hour, 2 days, etc., or select the Any option from the list to provide a From and To date/time for graph generation.
Finally, click the Submit button. Upon clicking, the detailed diagnosis of the specified measure for the given period, will appear (see Figure 1):
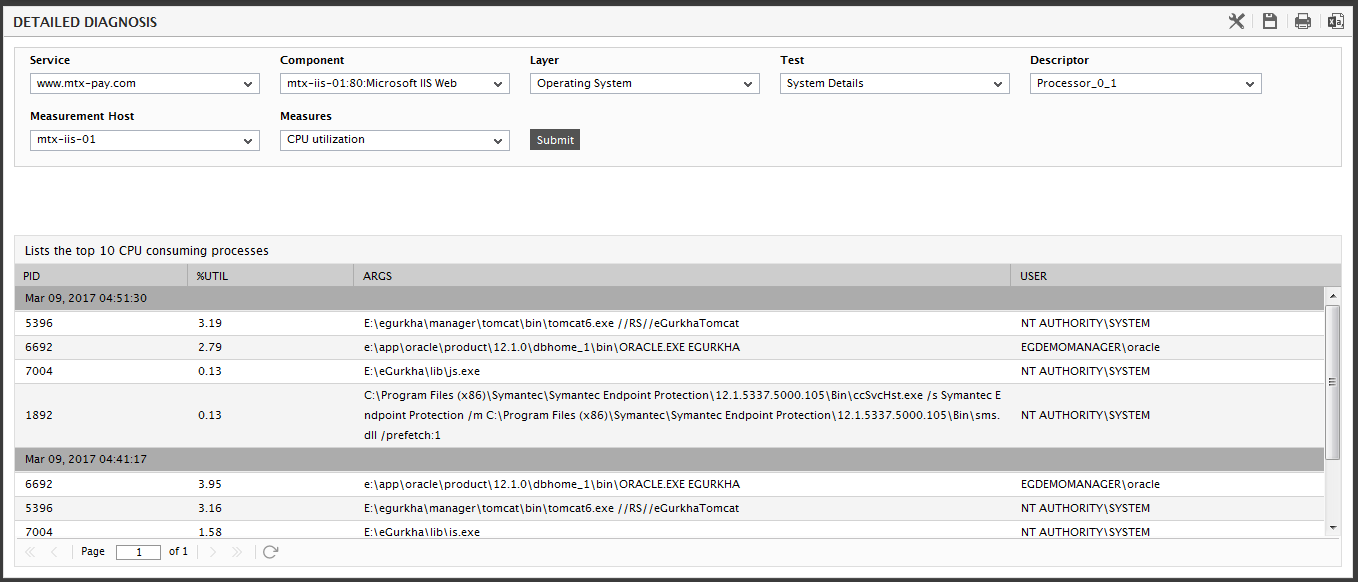
Figure 1 : Detailed diagnosis of the Cpu_util measure for a given period
By default, eG Enterprise displays detailed diagnostics pertaining to 10 measurement periods in a single page. If you want to override this setting, then you can set a value of your choice against the RecordsPerpage flag under the [DD_DISPLAY] section of the <eG_INSTALL_DIR>\manager\config\eg_format.ini file. This setting can also be overridden at the test-level. In other words, different measure period counts can be set for different tests. To achieve this, use the [DD_DISPLAY_RECORDS] section in the <eG_INSTALL_DIR>\manager\config\eg_format.ini file. For instance, if you want the detailed diagnosis of the Disk Activity test to display the records for 3 measurement periods, then you should specify DiskActivity=3 in this section.
You can also save the Detailed Diagnosis information as a CSV file by clicking on the  button at the top, right corner of Figure 1, and even print the detailed diagnosis by clicking on the
  button.