External Integration of Data from other Sources to My Dashboards
In environments spanning across multiple locations, data obtained in each location may be consolidated and stored in different forms (CSV, excel file, SQL database or as a REST API source). To build a consolidated dashboard which spans across all geographies, the eG manager is capable of integrating with an external source, pull the data and create a brand new dashboard.
To build a real time dashboard by integrating data from external sources, you need to follow the steps mentioned below:
- Configure a Data Source
- Configure the widgets to display the real time values based on the configured Data Source
How to Configure a Data Source?
eG Enterprise supports integrating data from various external sources to My Dashboards. For this, click on the Data Source button in Figure 1.

Figure 1 : Clicking the Data Source button
Figure 2 then appears. If no Data Source pre-exists, then"No Data Source Available" message will appear as shown in Figure 2.
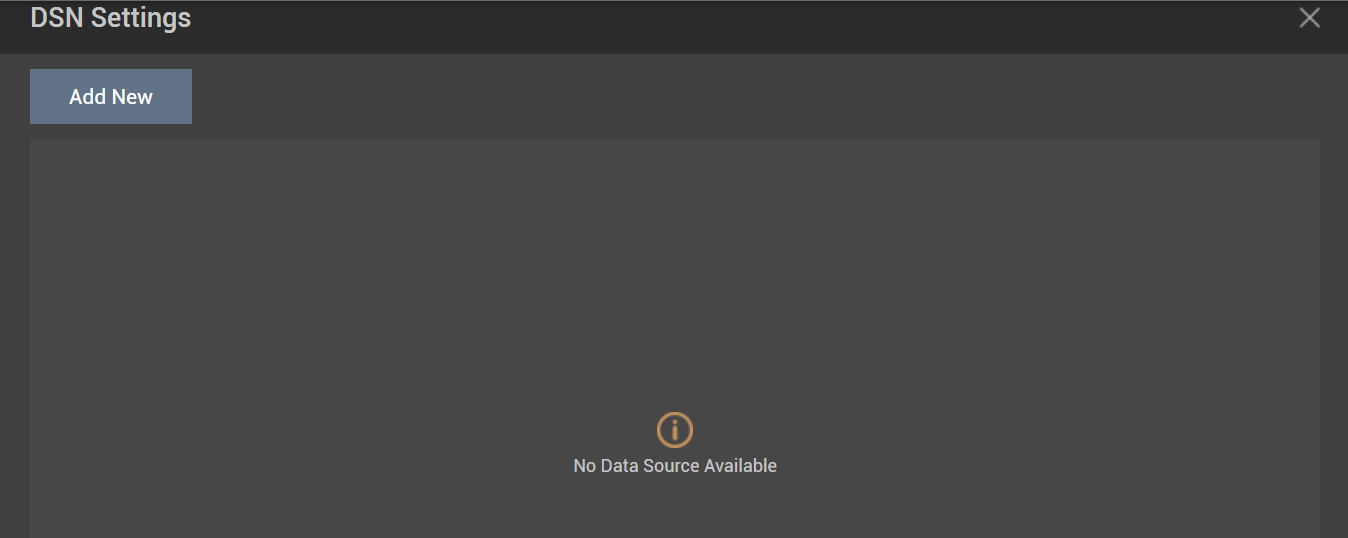
Figure 2 : The message that appears when no Data Source pre-exists
If one/more Data Sources pre-exists, then the data sources will be listed in the DSN Setting pop up window as shown in Figure 3.
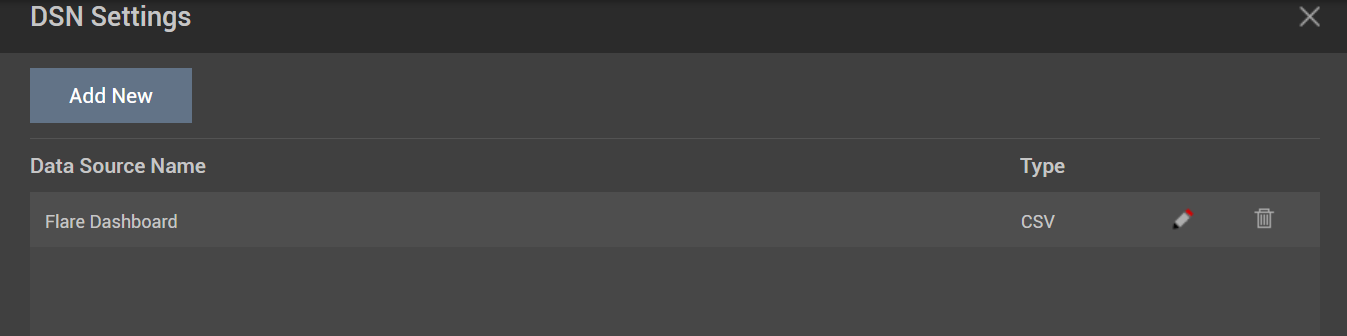
Figure 3 : Listing the Data Sources
To configure a new Data Source, click the Add New button inFigure 2. Figure 4 will then appear.
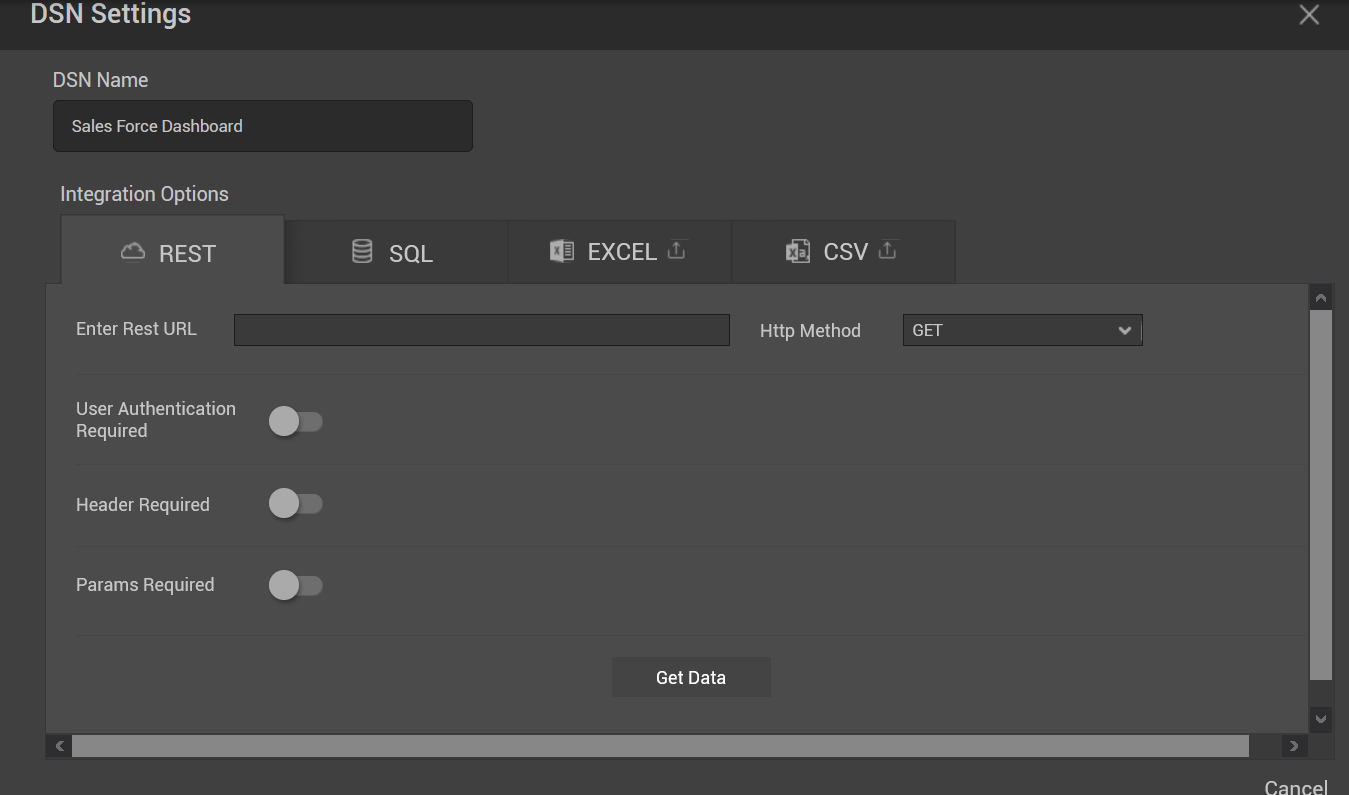
Figure 4 : Adding a new Data Source
In Figure 4, specify the name of the Data Source in the DSN Name text box.
Then, you need to choose the source through which you wish to obtain the data for integration with My Dashboards from the Integration Options section. By default, the REST tab will be chosen. The following sections will explain in detail on how to create a data source by obtaining data using REST API, SQL queries, EXCEL and CSV files.
Configuring a Data Source with Data obtained by executing REST Web Service
To create a Data Source with data obtained by executing the REST API in your environment, do the following:
-
Enter valid REST URL as shown in Figure 5.
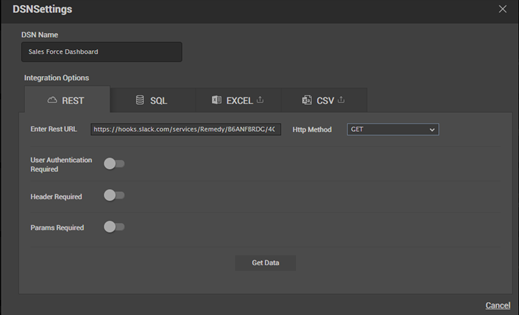
- Next, pick the required Http Method. By default, this is set to GET.
-
By default, the User Authentication Required slider is turned off (see Figure 5). This indicates that the data can be collected by any user from the REST URL. In some environments however, a specific user alone will be authorized to execute the REST API in order to collect the required data. In such environments, administrators can turn on the User Authentication Required slider (see Figure 6). This will enable the User name and Password text boxes. Specify the User name and Password of the user who is authorized to execute the REST API.

Figure 6 : Specify the credentials of the user authorized to execute the REST API
-
By default, the Header Required slider is turned off (see Figure 5) indicating that no additional information is provided in the HTTP header while executing the REST API. If you wish to provide additional information in the HTTP header, turn on the Header Required slider as shown in Figure 7. The Key and Value text boxes will then appear. Specify the Key and Value parameters that you need to include in the Header of the REST API and click the Add Header button. The KEY and VALUE columns in the section below will now be populated. To delete a Key and Value pair, select the check box preceding the Key and click the
 icon. To delete all the Key and Value pairs, select the check box preceding the KEY column and click the
  icon.
icon.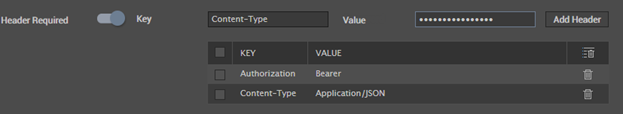
-
Similarly, the Params Required slider is turned off (see Figure 5) indicating that no additional parameters are specified as variable parts of your REST API resources i.e., the data that you are working on. If you wish to provide additional parameters, turn on the Parameter Required slider as shown in Figure 8. The Key and Value text boxes will then appear. Specify the Key and Value parameters that you need to include in the Header of the REST API and click the Add Param button. The KEY and VALUE columns in the section below will now be populated. To delete a Key and Value pair, select the check box preceding the Key and click the
icon. To delete all the Key and Value pairs, select the check box preceding the KEY column and click the icon.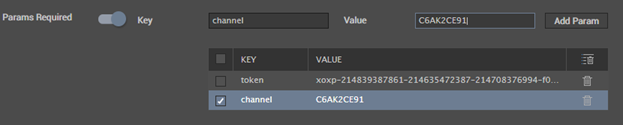
-
If POST is chosen from the Http method list, then an additional Body section will appear as shown in Figure 9. By default, the x-www-form-urlencoded flag will be chosen indicating that the keys and values are encoded in key-value tuples separated by '&', with a '=' between the key and the value. If you wish to post raw data, then you can choose the raw flag. Specify the Key and Value parameters that you need to include in the Body of the REST API and click the Add Body button. The KEY and VALUE columns in the section below will now be populated. To delete a Key and Value pair, select the check box preceding the Key and click the
icon. To delete all the Key and Value pairs, select the check box preceding the KEY column and click the icon.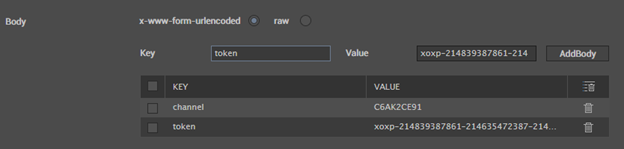
Figure 9 : Specifying the key and value pair for Body parameters
-
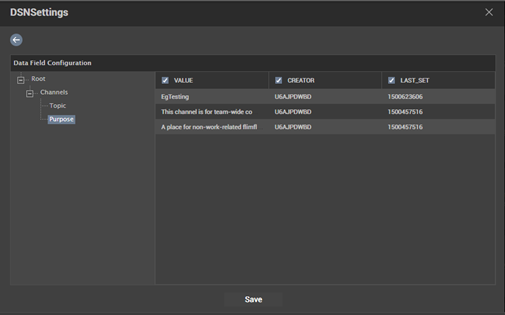
Now clicking the Get Data button will populate the DSN Settings pop up window with the data obtained by executing the REST API (see Figure 10).
-
Select the columns of your choice from the DSN Settings window by checking the check box preceding each column name. The Data Source will be created only with those columns that you have chosen.
- Clicking the Save button will save your selection and the Data Source will be created.
- Now, the Data source that you have created will be listed in the DSN Settings pop up window.
Configuring a Data Source with data obtained by executing Queries on the Database
To create a Data Source with data obtained by executing queries on the database available in your environment, do the following:
-
Select the type of database server available in your target environment from the DB Type list (see Figure 11).
- Specify the IP address/host of the target database server in the Host text box.
- Specify the port at which the database server listens to in the Port text box.
- In the User and Password text boxes, specify the credentials of the user who is authorized to access the target database server.
- In the Database text box, specify the exact name of the database on which the query is to be executed.
-
Next, in the Query text box, specify the query that should be executed to fetch the relevant data from the database.
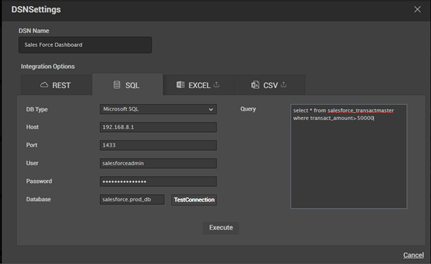
Figure 11 : Specifying the credentials to obtain data by executing the query on a database
-
Finally, click the Execute button. Figure 12 will then appear.
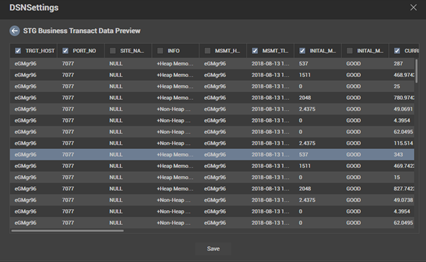
- In Figure 12, select the columns of your choice by checking the check box preceding each column name. The Data Source will be created only with those columns that you have chosen.
- Clicking the Save button will save your selection and the Data Source will be created.
Creating a Data Source with data imported using a CSV file
To create a Data Source with data imported using a CSV file, do the following:
-
Click the Browse file button against the File text box in Figure 13 to upload the CSV file that contains the data needed for integration with My Dashboards .
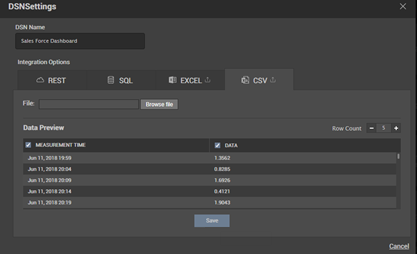
Figure 13 : Creating a Data Source with data imported using CSV file
- Once the upload is complete, the data will be previewed in the Data Preview section as individual columns (see Figure 13).
- Select the columns of your choice from the Data Preview section by checking the check box preceding each column name. The Data Source will be created only with those columns that you have chosen.
- You can also specify the number of rows that need to be displayed in the dashboard widget by selecting the Row count in Figure 13 accordingly.
- Clicking the Save button will save your selection and the Data Source will be created.
- Now, the Data source that you have created will be listed in the DSN Settings pop up window.
Configuring a Data Source with data imported using Microsoft EXCEL
To create a Data Source with data imported using an Excel file, do the following:
-
Click the Browse file button against the File text box in Figure 14 to upload the CSV file that contains the data needed for integration with My Dashboards.
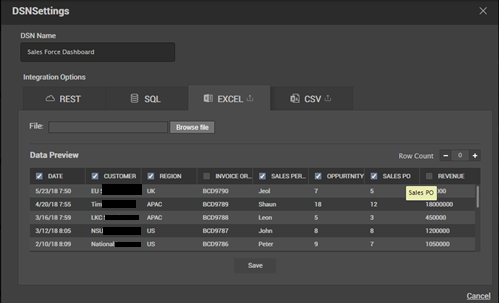
Figure 14 : Creating a Data Source with data imported using excel file
- Select the columns of your choice from the Data Preview section in Figure 14 by checking the check box preceding each column name. The Data Source will be created only with those columns that you have chosen.
- You can also specify the number of rows that need to be displayed in the dashboard widget by selecting the Row count in Figure 14 accordingly.
- Clicking the Save button will save your selection and the Data Source will be created.
- Now, the Data source that you have created will be listed in the DSN Settings pop up window.
Configure the Dashboard widgets using the created Data Source
Once the Data Sources of your choice are configured, you can use them to configure one/more dashboard widgets in My Dashboards. The following dashboard widgets alone can be configured with the data sources that are created:
-
Tabular view
-
Bar chart
-
Line chart
-
Timeline chart
-
Area chart
-
Gauge chart
-
Digital chart
-
Pie chart
-
Heat Map
-
Activity chart
To configure a dashboard widget for e.g., Digital chart with a data source, do the following:
-
Add one among the widgets from the above list to the My Dashboard that you have created and click the Edit option. In Figure 15 that appears, turn on the Use external data sources slider.
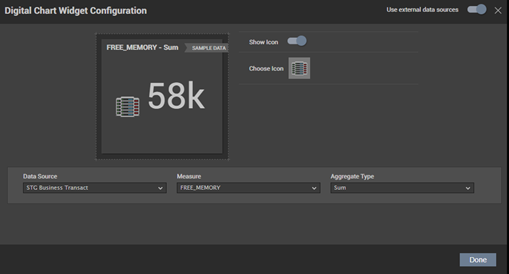
-
The Data Sources list box will not be populated with all the data sources that have been created. Choose the data source for which you are required to configure the dashboard widget.
-
The Measure list box will then be populated with all the measures that are available for the chosen data source. Choose a measure of your choice.
Then, specify the Aggregate Type that you wish to apply on the chosen Measure.
Clicking the Done button will add the widget to the My Dashboard that you have created. Figure 16 shows a sample dashboard widget added by integrating data obtained using an external data source.
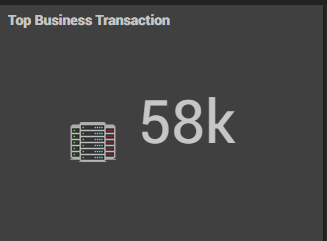
Figure 16 : A sample dashboard widget created using an external data source