Inside View Analysis
Though the outside view can point you to the resource-intensive VM on a virtual host, you would have to zoom into the problem VM to figure out what is causing the resource contention. For this purpose, you require an inside view of a VM. Using the inside view dashboard provided by eG Enterprise, you can perform an effective analysis of the internal workings of a particular VM.
To access this dashboard, pick the Inside view of VMs option from the Subsystem list in the Virtual tab page, and then pick the vm of interest to you.
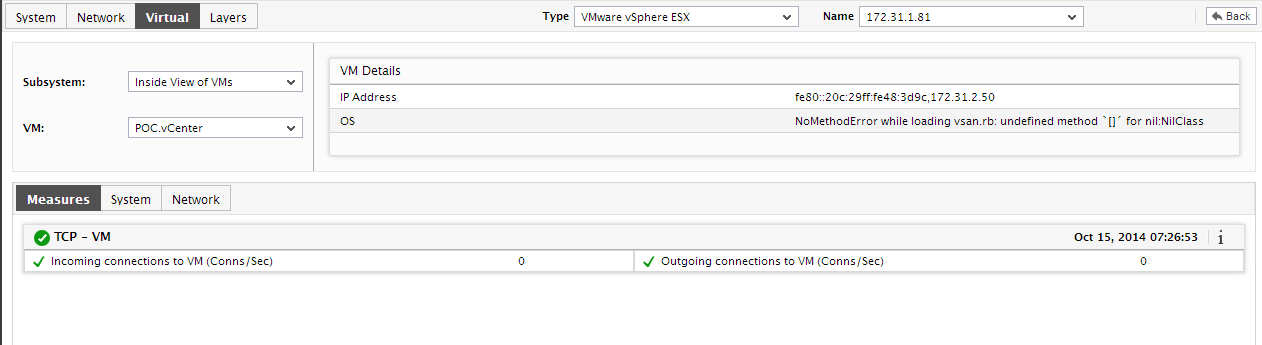
Figure 1 : The Inside view of VMs dashboard
Doing so will display all the performance metrics extracted from within the chosen guest, in real-time. You are thus enabled to cross-correlate across the various metrics, and quickly detect the root-cause of current/probable disturbances to the internal health of a guest.
To view the time-of-day variations in a measure, you can view its graph by clicking on that measure. By default, the graph in Figure 1 is plotted for a period of 1 hour. If need be, you can alter the graph Timeline, so that you can effectively analyze performance patterns across longer/shorter time periods.
If the VM had been migrated/Vmotioned to another ESX server during the specified Timeline, then the resulting graph will depict how that measure has performed in both the ESX servers. This way, you can better understand the impact of a VM migration across ESX servers, and decide on resource allocations and subsequent migrations accordingly.